


Trend Analysis (Fig. 1)
On Tuesday, the market may continue moving downward from the level of 1.3280 (closing of yesterday's daily candle), targeting 1.3243 – the 14.6% retracement level (red dashed line). Upon testing this level, the price may begin moving upward toward 1.3364 – the upper fractal (blue dashed line).
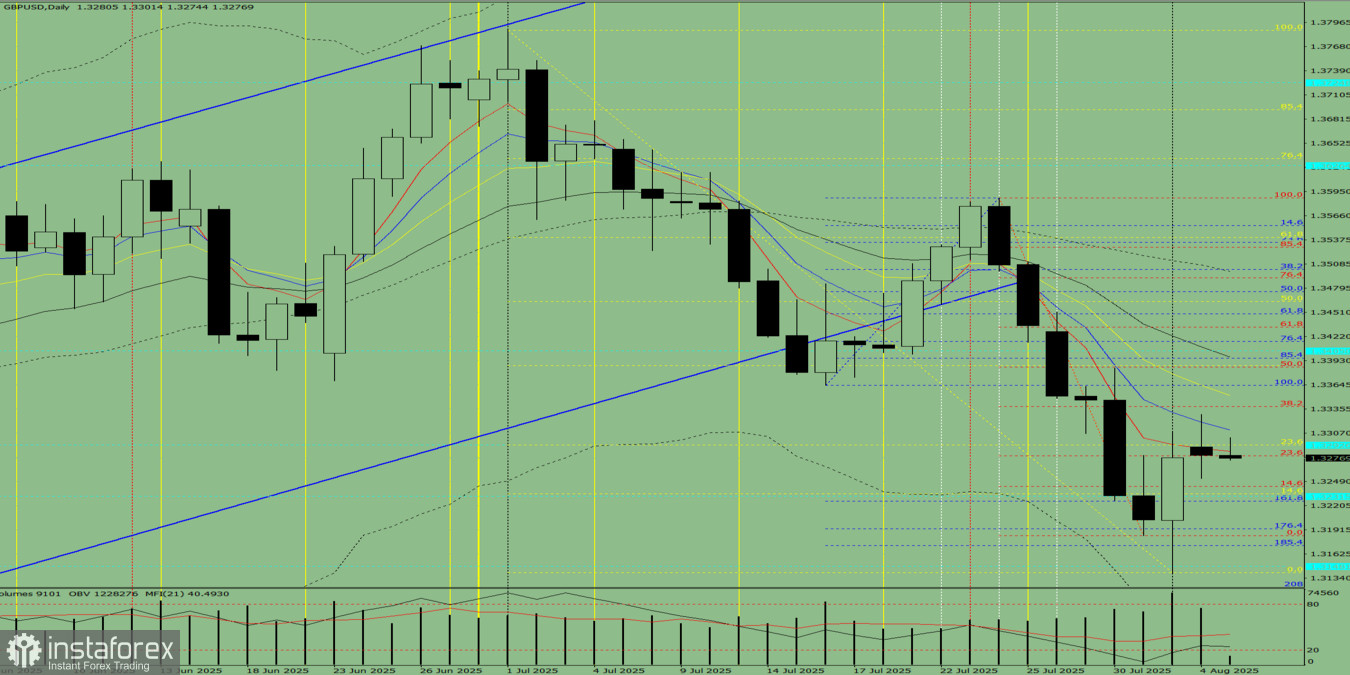
Fig. 1 (Daily Chart)
Comprehensive Analysis:
- Indicator analysis – down
- Volume – down
- Candlestick analysis – down
- Trend analysis – down
- Bollinger Bands – down
- Weekly chart – down
Overall conclusion: Downward trend.
Alternative Scenario: The price may continue moving downward from the level of 1.3280 (closing of yesterday's daily candle) toward 1.3225 – the 161.8% target level (blue dashed line). Upon testing this level, the price may begin moving upward toward the upper fractal at 1.3364 (blue dashed line).


