


Trend Analysis (Fig. 1)
On Wednesday, from the 1.3296 level (yesterday's daily candle close), the market may continue moving upward toward the target at 1.3338 — the 38.2% retracement level (red dashed line). If this level is tested, the price may continue its upward movement toward the 1.3364 target — the upper fractal (blue dashed line).
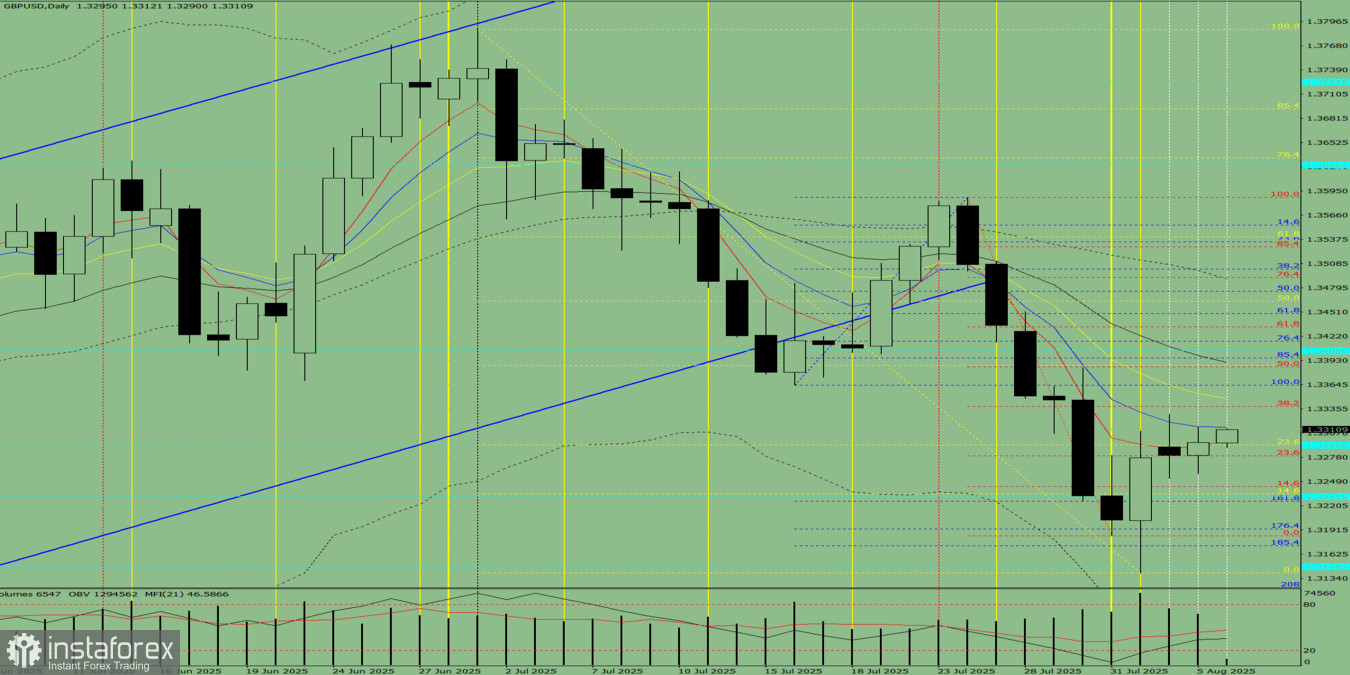
Fig. 1 (Daily Chart)
Comprehensive Analysis:
- Indicator analysis – upward
- Fibonacci levels – upward
- Volume – upward
- Candlestick analysis – downward
- Trend analysis – upward
- Bollinger Bands – upward
- Weekly chart – upward
Overall conclusion: upward trend.
Alternative scenario: On Wednesday, from the 1.3296 level (yesterday's daily candle close), the market may continue moving upward toward the 38.2% retracement level at 1.3338 (red dashed line). If this level is tested, the price may retrace downward toward the target of 1.3314 — the 8 EMA (thin blue line).


