


Trend analysis (Fig. 1).
On Friday, from the level of 1.3440 (yesterday's daily candle close), the market may start moving downward toward 1.3378 — the 23.6% retracement level (yellow dashed line). Upon testing this level, the price may move upward toward 1.3452 — the upper fractal (yellow dashed line).
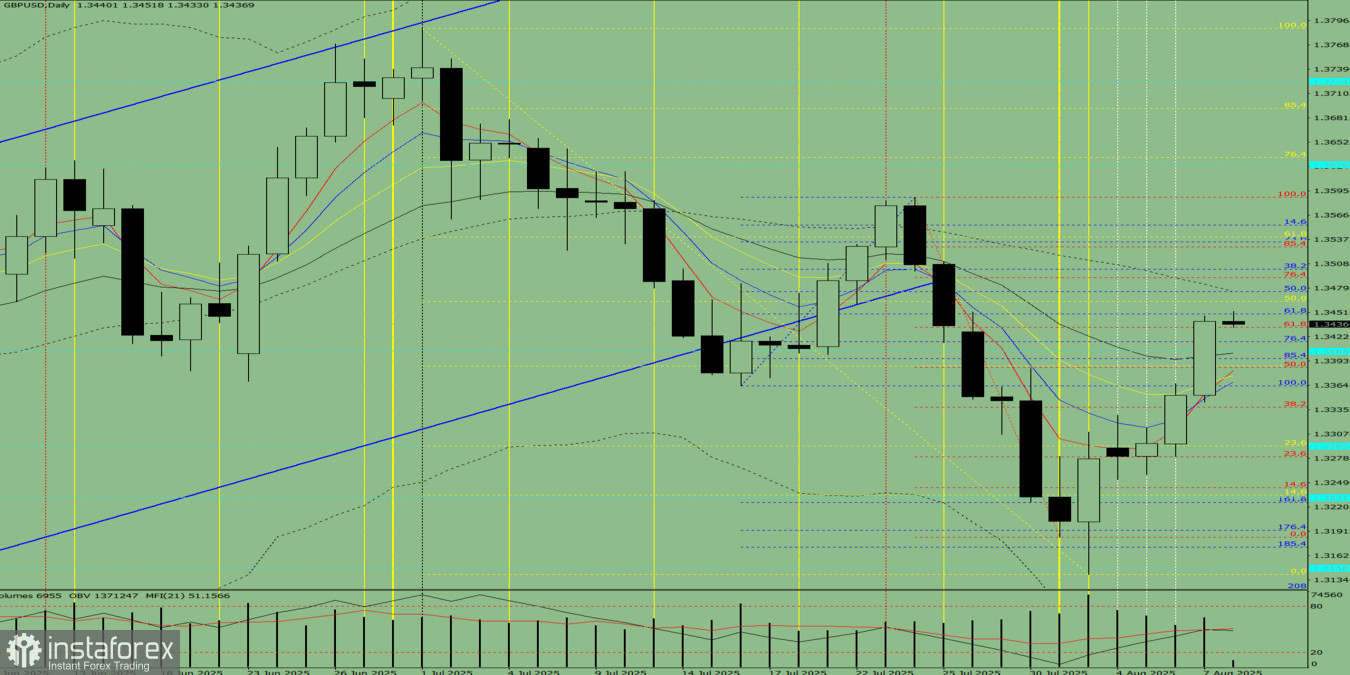
Fig. 1 (daily chart).
Comprehensive analysis:
- Indicator analysis – down;
- Fibonacci levels – down;
- Volumes – down;
- Candlestick analysis – down;
- Trend analysis – down;
- Bollinger Bands – down;
- Weekly chart – down.
Overall conclusion: Downward trend.
Alternative scenario: From the level of 1.3440 (yesterday's daily candle close), the price may continue moving downward toward 1.3406 — the 14.6% retracement level (yellow dashed line). Upon testing this level, the price may move upward toward 1.3452 — the upper fractal (yellow dashed line).


