


Trend Analysis (Fig. 1).
On Monday, from the 1.3450 level (Friday's daily candle close), the market may continue moving upward toward 1.3481 – the 76.4% retracement level (red dotted line). Upon testing this level, the price may begin moving downward toward 1.3416 – the 61.8% retracement level (red dotted line).
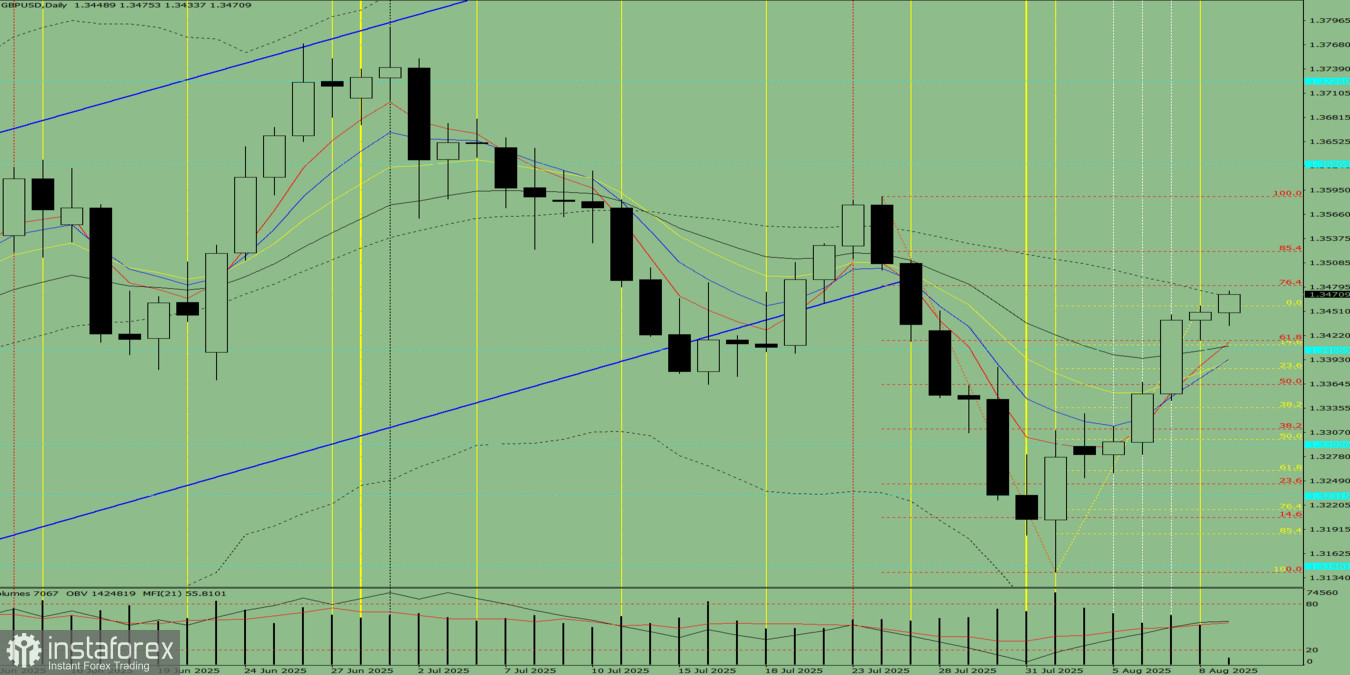
Fig. 1 (Daily Chart).
Comprehensive Analysis:
- Indicator analysis – upward
- Fibonacci levels – upward
- Volumes – upward
- Candlestick analysis – upward
- Trend analysis – upward
- Bollinger Bands – upward
- Weekly chart – upward
Overall conclusion: upward trend.
Alternative scenario: from the 1.3450 level (Friday's daily candle close), the price may continue moving upward toward 1.3522 – the 85.4% retracement level (red dotted line). Upon reaching this level, a pullback downward toward 1.3481 – the 76.4% retracement level (red dotted line) is possible.


