


Trend Analysis
This week, from the 1.3450 level (close to the last weekly candle), the price may start moving downward toward 1.3270 – a historical support level (blue dotted line). Upon testing this level, the price may continue moving downward toward 1.3141 – the 38.2% retracement level (red dotted line).
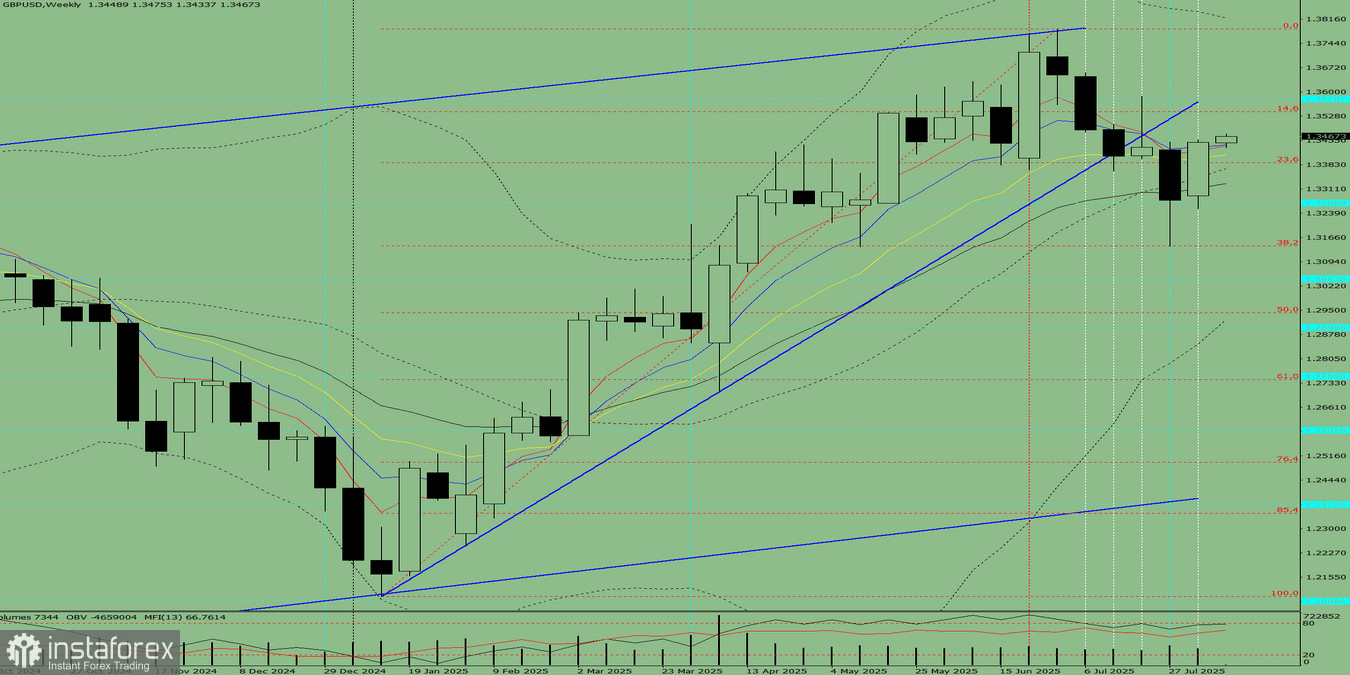
Fig. 1 (Weekly Chart).
Comprehensive Analysis:
- Indicator analysis – downward
- Fibonacci levels – downward
- Volumes – downward
- Candlestick analysis – downward
- Trend analysis – downward
- Bollinger Bands – downward
- Monthly chart – downward
Conclusion from comprehensive analysis: downward movement.
Overall forecast for the weekly GBP/USD candle: the price will most likely maintain a bearish trend during the week, with no upper shadow on the weekly black candle (Monday – downward movement) and a lower shadow (Friday – upward movement).
Alternative scenario: from the 1.3450 level (close of the last weekly candle), the price may start moving downward toward 1.3270 – a historical support level (blue dotted line). Upon reaching this level, the price may then move upward toward 1.3313 – the 21-period EMA (thin black line).


