


Trend Analysis (Fig. 1).
On Tuesday, from the level of 1.1614 (yesterday's daily close), the market may continue moving downward toward 1.1581 – the 38.2% retracement level (blue dashed line). Upon testing this level, the price may rebound upward to test the 50% retracement level at 1.1594 (yellow dashed line).
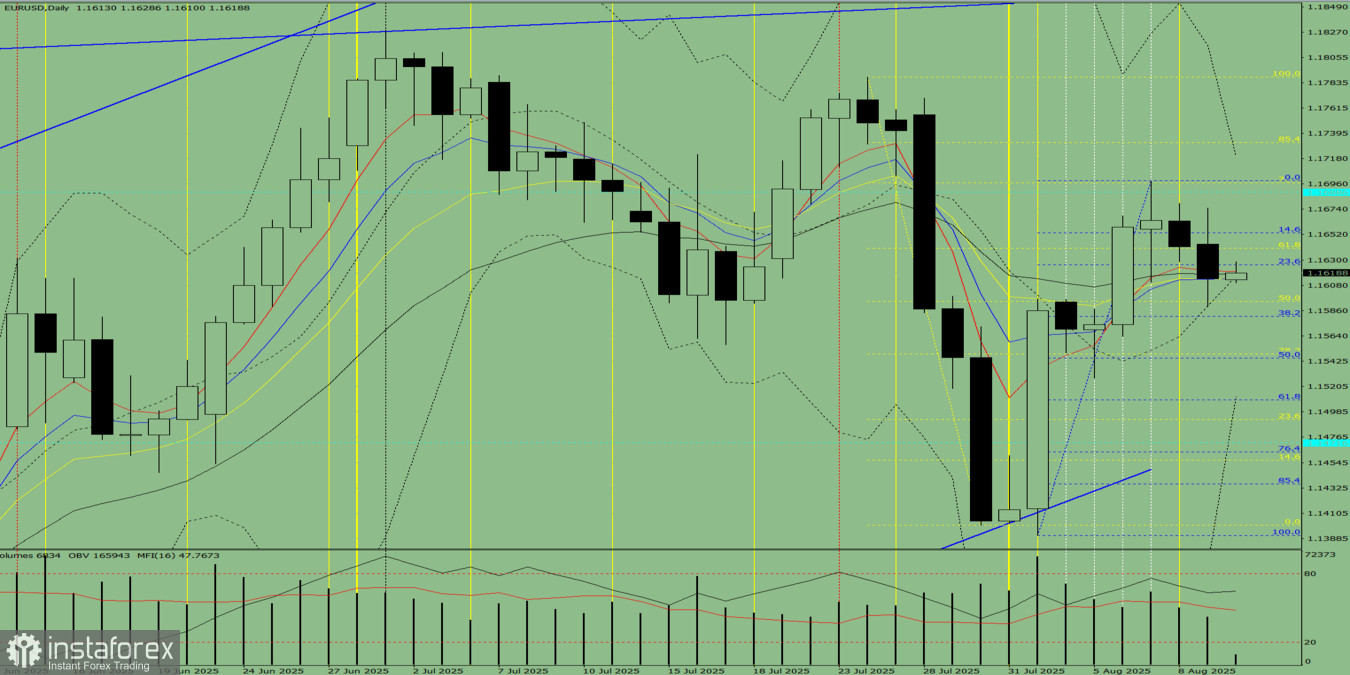
Fig. 1 (Daily Chart).
Comprehensive Analysis:
- Indicator analysis – down;
- Volume – down;
- Candlestick analysis – down;
- Trend analysis – down;
- Bollinger Bands – down;
- Weekly chart – down.
Overall conclusion: Downward trend.
Alternative scenario: From the level of 1.1614 (yesterday's daily close), the price may continue moving downward toward 1.1545 – the 50% retracement level (blue dashed line). Upon testing this level, the price may rebound upward to test the 38.2% retracement level at 1.1581 (blue dashed line).


