


Trend Analysis (Fig. 1).
On Tuesday, from the level of 1.3428 (yesterday's daily close), the market may continue moving downward toward 1.3364 – the 50% retracement level (red dashed line). Upon testing this level, the price may start moving upward toward 1.3382 – the 23.6% retracement level (yellow dashed line).
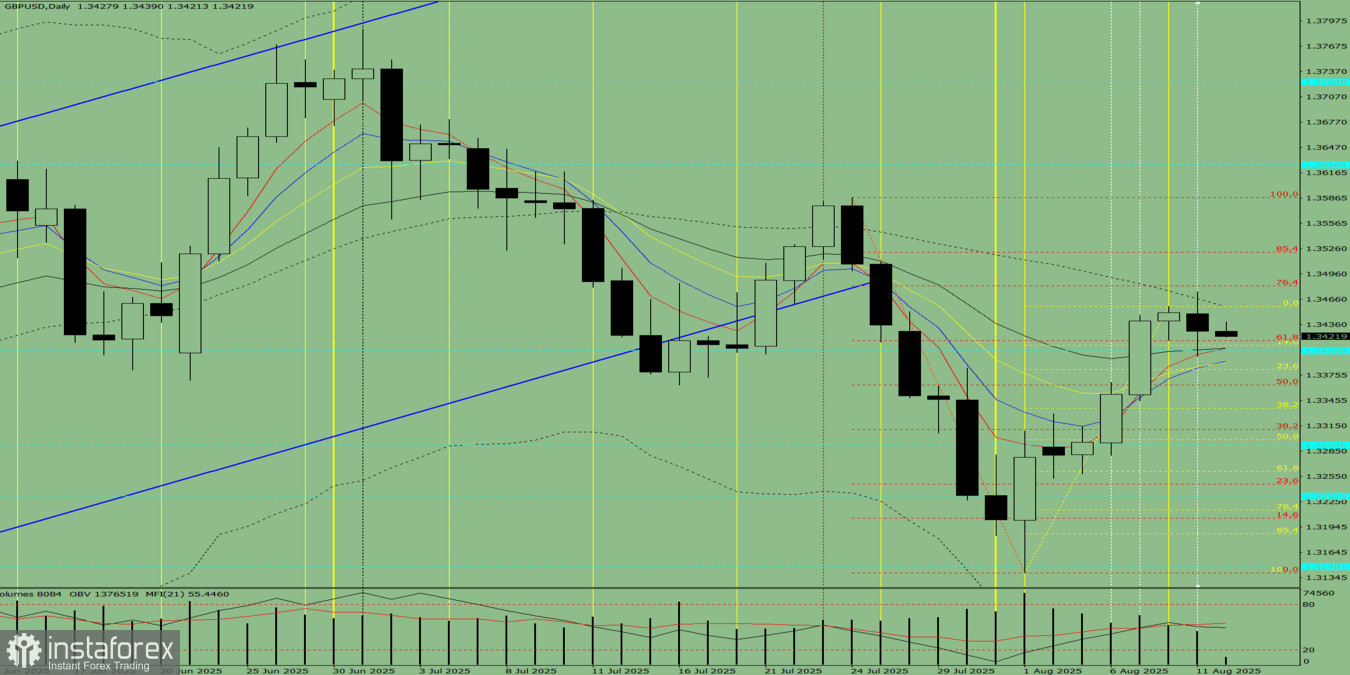
Fig. 1 (Daily Chart).
Comprehensive Analysis:
- Indicator analysis – down;
- Volume – down;
- Candlestick analysis – down;
- Trend analysis – down;
- Bollinger Bands – down;
- Weekly chart – down.
Overall conclusion: Downward trend.
Alternative scenario: From the level of 1.3428 (yesterday's daily close), the price may continue moving downward toward 1.3382 – the 23.6% retracement level (yellow dashed line). Upon testing this level, the price may start moving upward toward 1.3485 – the historical resistance level (blue dashed line).


