


Trend Analysis (Fig. 1)
On Wednesday, from the level of 1.3495 (yesterday's daily candle close), the market may continue moving upward toward 1.3522 – the 85.4% retracement level (red dotted line). Upon testing this level, the price may continue rising toward 1.3587 – the upper fractal (red dotted line).
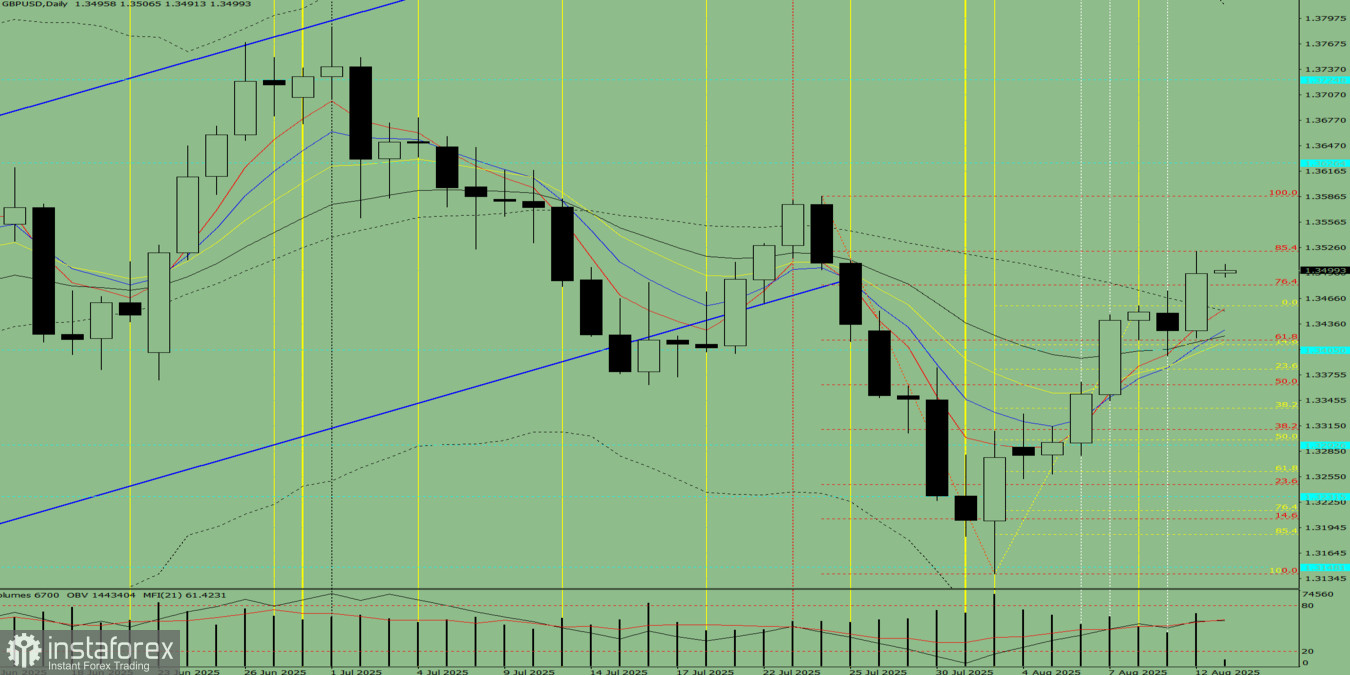
Fig. 1 (Daily Chart)
Comprehensive Analysis:
- Indicator analysis – upward;
- Fibonacci levels – upward;
- Volumes – upward;
- Candlestick analysis – downward;
- Trend analysis – upward;
- Bollinger Bands – upward;
- Weekly chart – upward.
Overall conclusion: Upward trend.
Alternative scenario: On Wednesday, from the level of 1.3495 (yesterday's daily candle close), the market may continue moving upward toward 1.3522 – the 85.4% retracement level (red dotted line). Upon testing this level, the price may retrace downward toward 1.3482 – the 76.4% retracement level (red dotted line).


