


EUR/USD 5-Minute Analysis
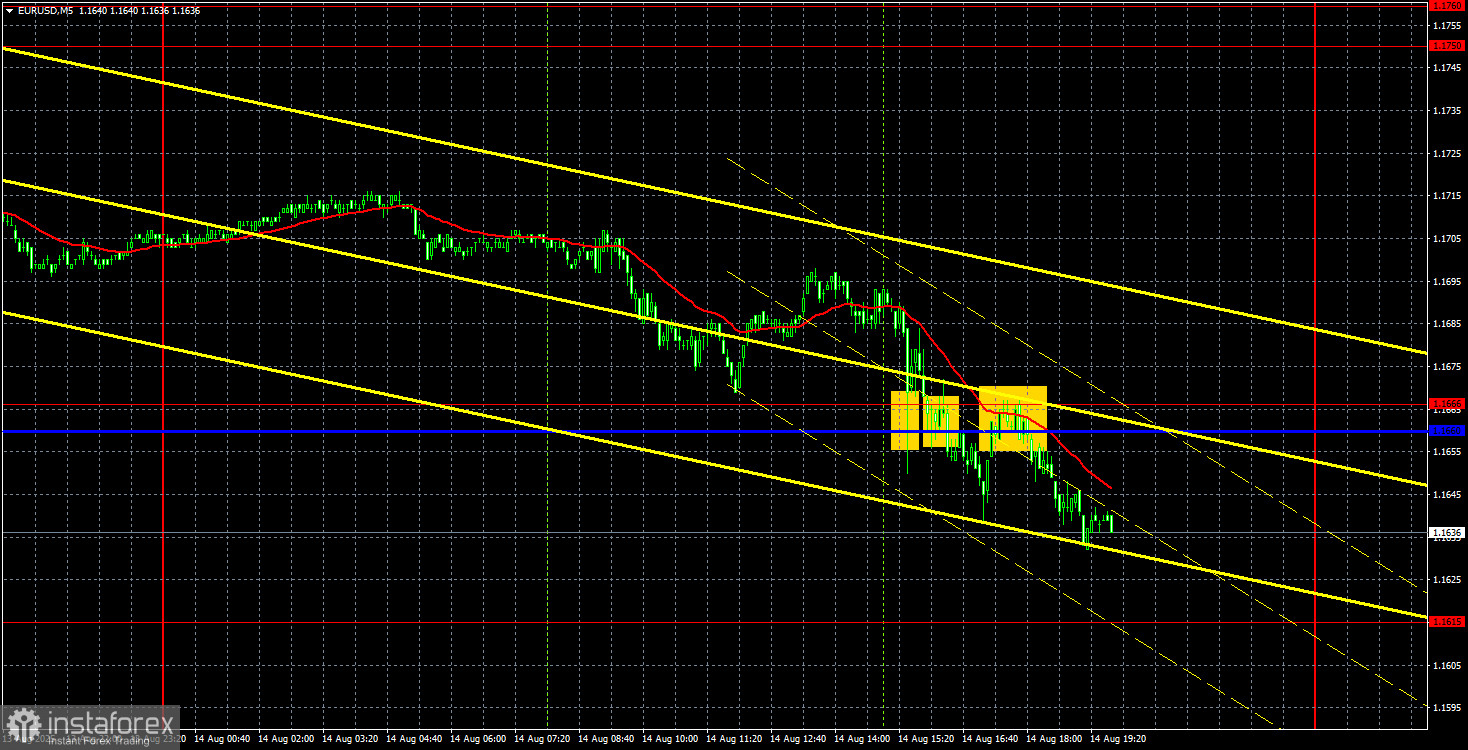
On Thursday, the EUR/USD currency pair showed a decent decline, which fully aligns with the current technical picture. It should be noted that an uptrend does not mean the price must constantly rise. On Thursday, we saw a minor correction that in no way affected the current trend — it remains upward. The market paid no attention to European data, while GDP and industrial production data were, as usual, weak. However, the U.S. session brought a surprise. The Producer Price Index, which usually fluctuates around 0.1–0.3% month-on-month, rose this time by 0.9%. The Core Producer Price Index also rose by 0.9%. In annual terms, it reached 3.7%. This means that U.S. companies have started sharply raising prices.
That said, both Jerome Powell and many experts had earlier warned that inflation in the U.S. would increase. Retailers had been keeping prices stable for as long as possible, relying on old inventories. But everything has its limit. A high PPI reduces the likelihood of a major Federal Reserve rate cut in the near term, but does not affect the September 17 Fed meeting.
On the 5-minute chart, three trading signals were formed on Thursday around the 1.1660–1.1666 area. First, the price bounced from this area, but it was a false signal. Then there was a breakout of the area and a bounce from it from below. Thus, traders could first open long positions (break-even — the price moved 15 pips upward), then short positions (small profit and the option to carry them over to Friday).
COT Report
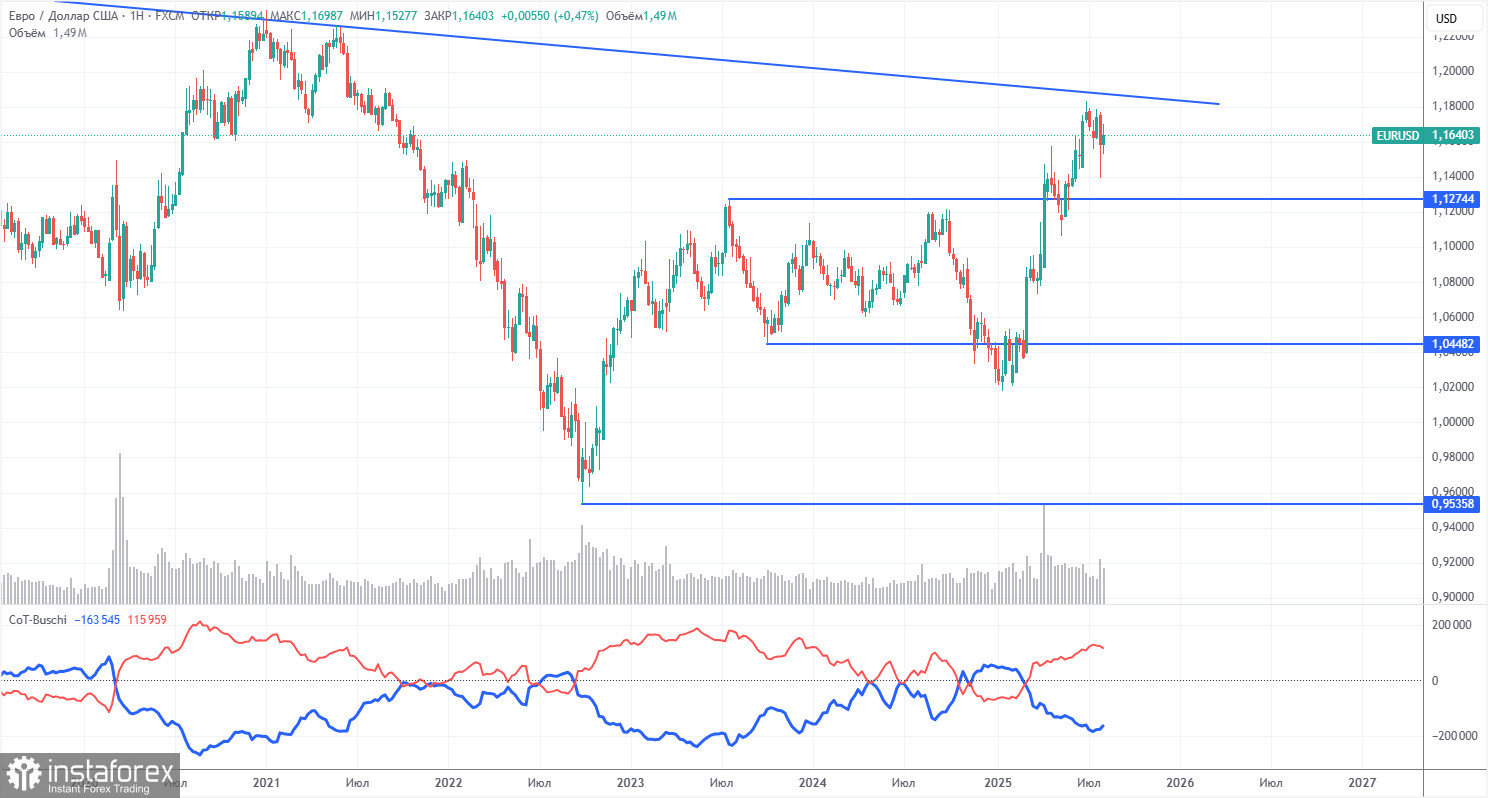
The latest COT report is dated August 5. As the chart above clearly shows, the net position of non-commercial traders had been bullish for a long time, while bears barely entered the dominance zone at the end of 2024 but quickly lost it. Since Donald Trump took office, the dollar has only been falling. We cannot say with 100% certainty that the decline of the U.S. currency will continue, but current global developments point precisely in that direction.
We still see no fundamental factors for strengthening the euro, but there remains one very significant factor for the dollar's decline. The long-term downtrend remains intact, but at this point, what does it matter where the price has moved over the past 17 years? Once Trump ends his trade wars, the dollar may start to rise, but recent events have shown that the war will continue in one form or another.
The positioning of the red and blue indicator lines still signals a bullish trend. During the last reporting week, the number of long positions among the "Non-commercial" group decreased by 1,400, while short positions increased by 5,900. As a result, the net position fell by 7,300 contracts over the week — an insignificant change.
EUR/USD 1-Hour Analysis
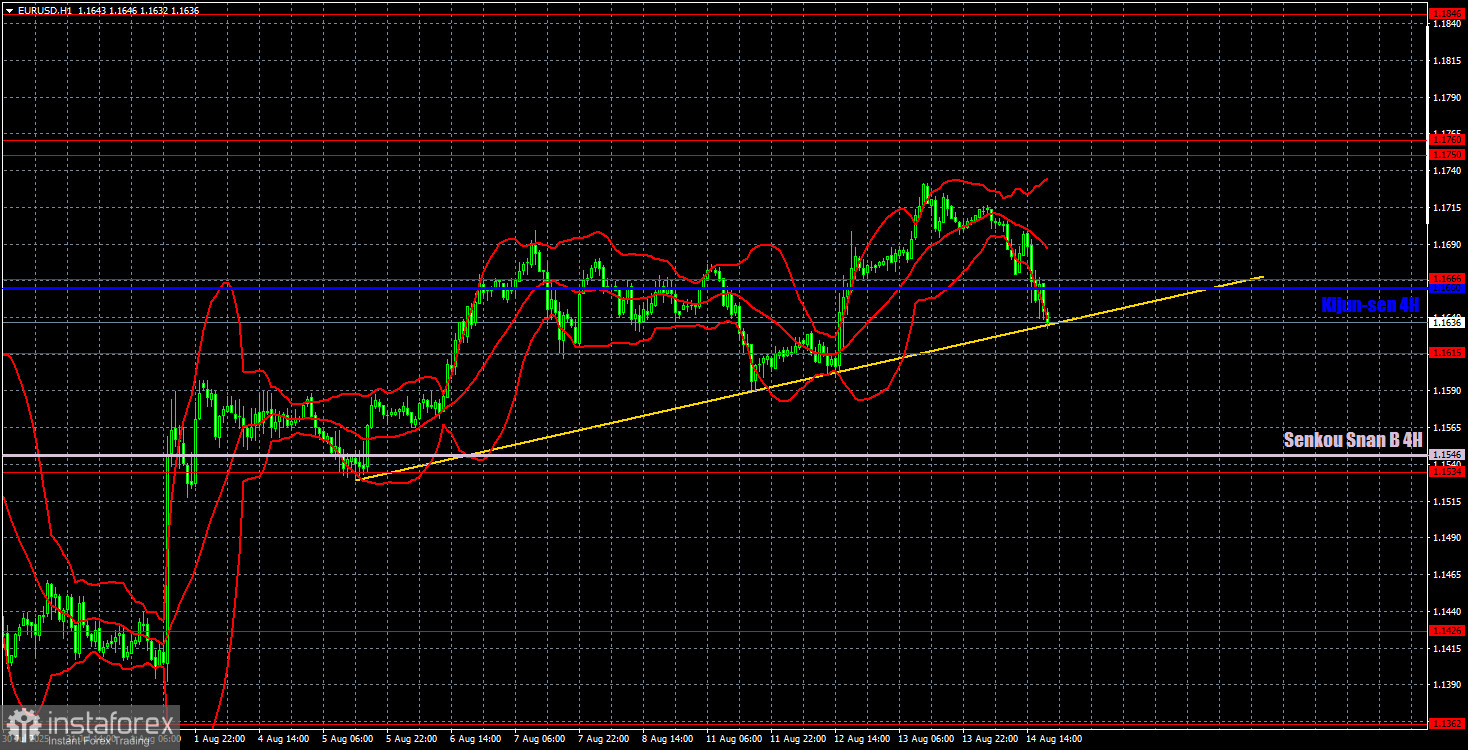
On the hourly chart, the EUR/USD pair continues to form a new uptrend. The latest upward wave began after the price rebounded from the Senkou Span B line on the daily chart. Thus, the dollar corrected very technically, and the uptrend remained intact. On Thursday, the price moved slightly lower and may even consolidate below the trendline. However, in our view, this will not significantly change the situation and certainly will not open bright prospects for the dollar.
For August 15, we highlight the following trading levels — 1.1092, 1.1147, 1.1185, 1.1234, 1.1274, 1.1362, 1.1426, 1.1534, 1.1615, 1.1666, 1.1750–1.1760, 1.1846–1.1857, as well as the Senkou Span B line (1.1546) and the Kijun-sen line (1.1660). The Ichimoku indicator lines may move during the day, which should be considered when determining trading signals. Do not forget to set a Stop Loss to break even if the price moves 15 pips in the right direction. This will protect against potential losses if the signal turns out to be false.
On Friday, no important events are scheduled in the Eurozone, while the U.S. will publish reports on retail sales, industrial production, and consumer sentiment. The data are not the most important, but if the figures are significantly different from forecasts, a market reaction may follow. Late in the evening, a meeting between Vladimir Putin and Donald Trump is scheduled.
Trading Recommendations
On Friday, the pair may resume its upward movement if it bounces from the trendline or the Senkou Span B line. In this case, long positions will once again be relevant. If the trendline is broken, a decline toward the Senkou Span B line can be expected for some time.
Illustration Explanations:
- Support and resistance price levels – thick red lines where movement may end. They are not trading signal sources.
- Kijun-sen and Senkou Span B lines—These are strong Ichimoku indicator lines transferred to the hourly timeframe from the 4-hour one.
- Extremum levels – thin red lines where the price has previously rebounded. These act as trading signal sources.
- Yellow lines – trend lines, trend channels, and other technical patterns.
- COT Indicator 1 on the charts – the size of the net position for each category of traders.


