


Trend Analysis (Fig. 1)
On Friday, from the level of 1.3526 (yesterday's daily candle close), the market may begin moving upward toward 1.3593 – the upper fractal (yellow dotted line). Upon testing this level, a pullback downward is possible.
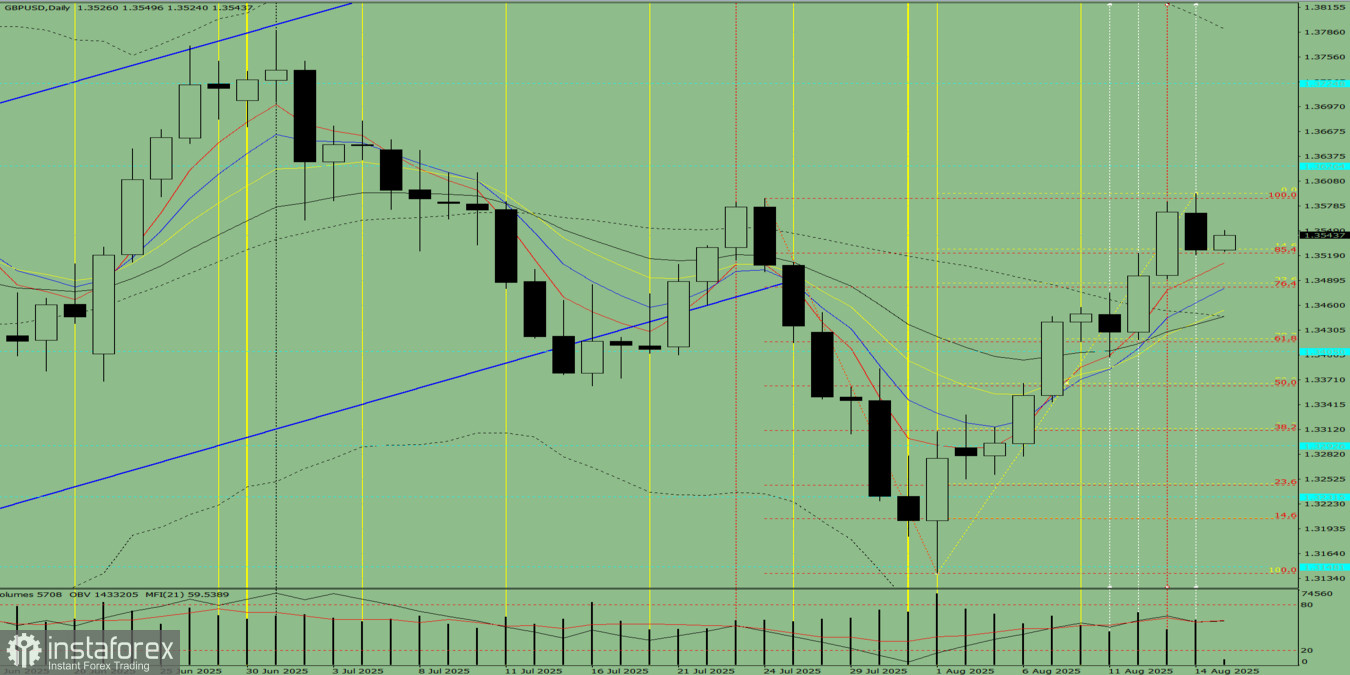
Fig. 1 (Daily Chart)
Comprehensive Analysis:
- Indicator analysis – upward;
- Fibonacci levels – upward;
- Volumes – upward;
- Candlestick analysis – upward;
- Trend analysis – upward;
- Bollinger Bands – upward;
- Weekly chart – upward.
Overall conclusion: Uptrend.
Alternative scenario: From the level of 1.3526 (yesterday's daily candle close), the price may begin moving upward toward 1.3593 – the upper fractal (yellow dotted line). Upon testing this level, the price may continue moving upward toward 1.3626 – the historical resistance level (blue dotted line).


