


Trade Review and Tips on the Japanese Yen
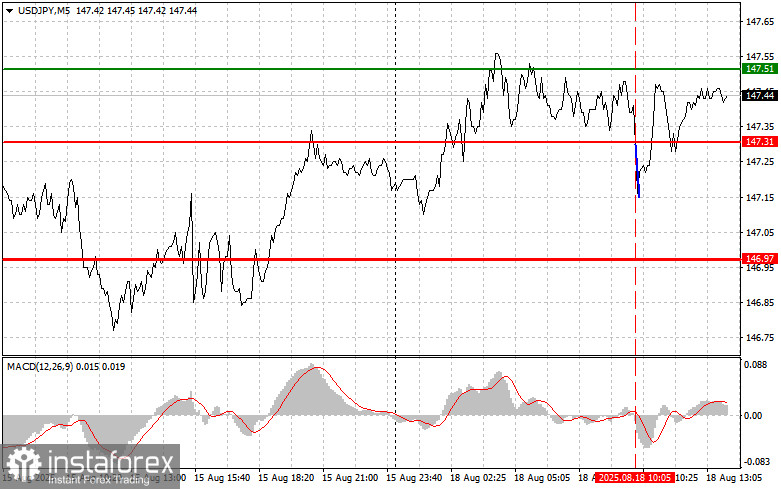
The test of 147.31 coincided with the MACD indicator just beginning to move down from the zero line, confirming the correct entry point for selling the dollar. As a result, the pair declined by only 15 points.
During the U.S. session, the NAHB housing market index is unlikely to significantly affect the direction of the USD/JPY pair. Market participants will likely shift their focus to other factors influencing this currency pair, primarily speeches from Federal Reserve officials.
It is also important to take into account the ongoing influence of Bank of Japan policy. Despite some pressure from the government and markets, the regulator has so far shown no clear readiness to continue raising rates. Any hints of a change in the Bank of Japan's stance could trigger sharp volatility in the USD/JPY pair.
As for intraday strategy, I will mainly rely on Scenarios #1 and #2.
Buy Signal
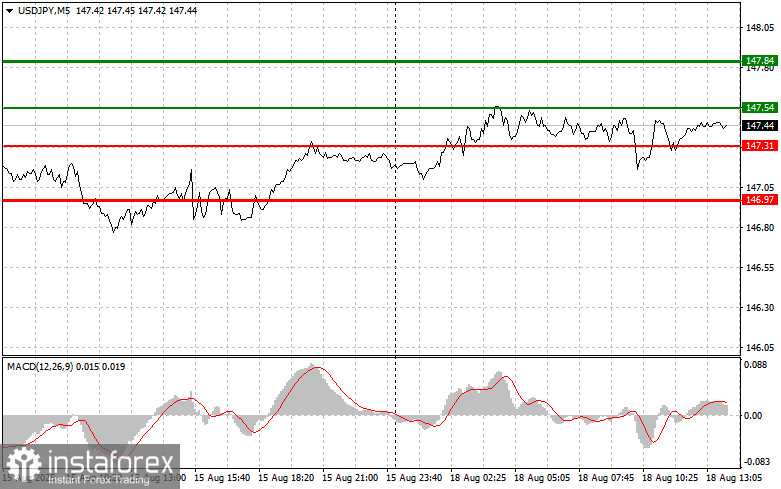
Scenario #1: I plan to buy USD/JPY today at the entry point around 147.54 (green line on the chart), targeting growth toward 147.84 (thicker green line on the chart). Around 147.84, I will exit purchases and open sales in the opposite direction (expecting a move of 30–35 points in the opposite direction from that level). A slight increase in the pair may be expected following strong data.Important! Before buying, make sure the MACD indicator is above the zero line and just beginning to move upward.
Scenario #2: I also plan to buy USD/JPY in case of two consecutive tests of 147.31 while the MACD indicator is in the oversold area. This will limit the pair's downward potential and lead to a market reversal upward. Growth toward 147.54 and 147.84 can be expected.
Sell Signal
Scenario #1: I plan to sell USD/JPY today after updating the 147.31 level (red line on the chart), which will lead to a quick decline in the pair. The key target for sellers will be 146.97, where I will exit sales and immediately open purchases in the opposite direction (expecting a rebound of 20–25 points in the opposite direction from that level). Pressure on the pair will return in the case of weak statistics.Important! Before selling, make sure the MACD indicator is below the zero line and just beginning to move downward.
Scenario #2: I also plan to sell USD/JPY in case of two consecutive tests of 147.54 while the MACD indicator is in the overbought area. This will limit the pair's upward potential and lead to a market reversal downward. A decline toward 147.31 and 146.97 can be expected.
What's on the chart:
- Thin green line – entry price for buying the instrument;
- Thick green line – assumed price for placing Take Profit or manually securing profit, as further growth above this level is unlikely;
- Thin red line – entry price for selling the instrument;
- Thick red line – assumed price for placing Take Profit or manually securing profit, as further decline below this level is unlikely;
- MACD indicator – when entering the market, it is important to follow overbought and oversold zones.
Important. Beginner Forex traders must be very cautious in making entry decisions. Before the release of important fundamental reports, it is best to stay out of the market to avoid sharp fluctuations. If you decide to trade during news releases, always place stop orders to minimize losses. Without stop orders, you can quickly lose your entire deposit, especially if you do not apply money management and trade large volumes.
And remember, successful trading requires a clear trading plan like the one I outlined above. Spontaneous decisions based on current market conditions are an inherently losing strategy for intraday traders.


