


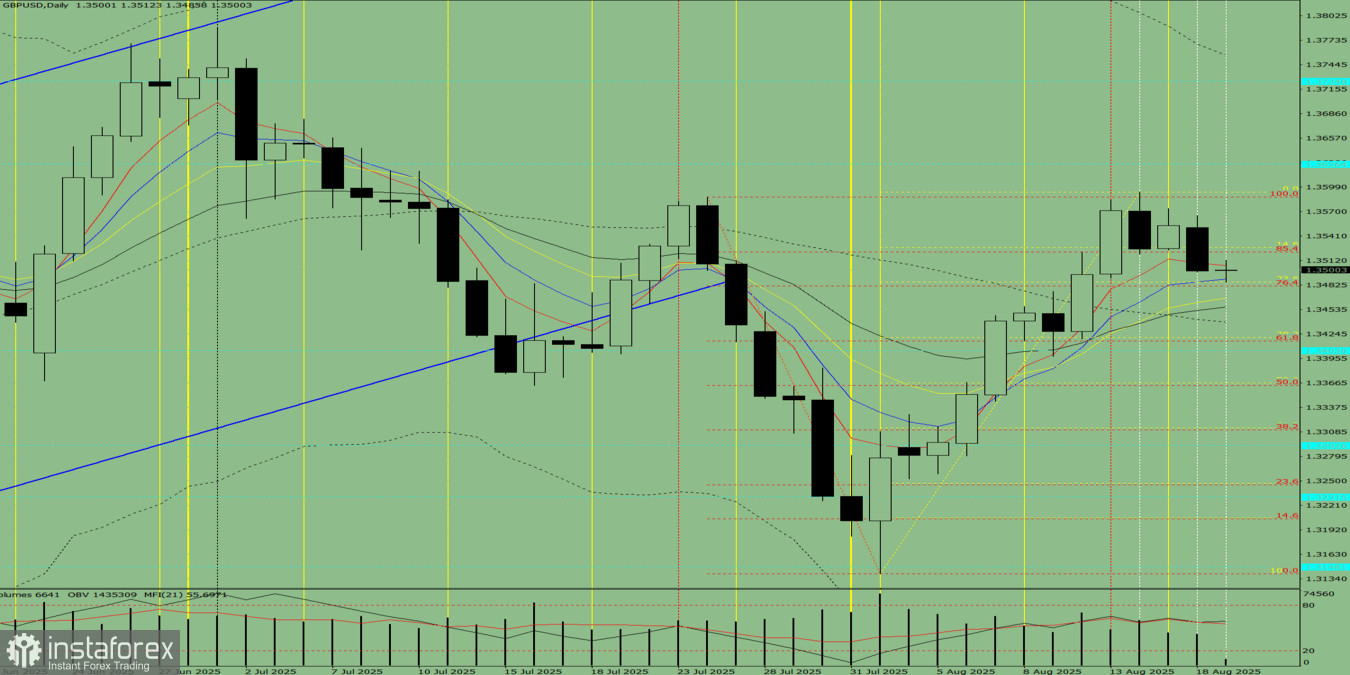
Trend Analysis (Fig. 1).
On Tuesday, from the 1.3500 level (closing price of yesterday's daily candle), the market may continue moving downward toward 1.3451 – the 21-day EMA (thin black line). Upon testing this line, the price may begin to move upward, aiming for 1.3481 – the 76.4% retracement level (red dashed line).
Comprehensive Analysis:
- Indicator analysis – downward;
- Volumes – downward;
- Candlestick analysis – downward;
- Trend analysis – downward;
- Bollinger Bands – downward;
- Weekly chart – downward.
Overall conclusion: bearish trend.
Alternative scenario: From the 1.3500 level (closing price of yesterday's daily candle), the price may continue moving downward toward 1.3416 – the 61.8% retracement level (red dashed line). Upon testing this level, the price may begin to move upward, aiming for 1.3451 – the 21-day EMA (thin black line).


