


Analysis of Monday's Trades
1H Chart of GBP/USD
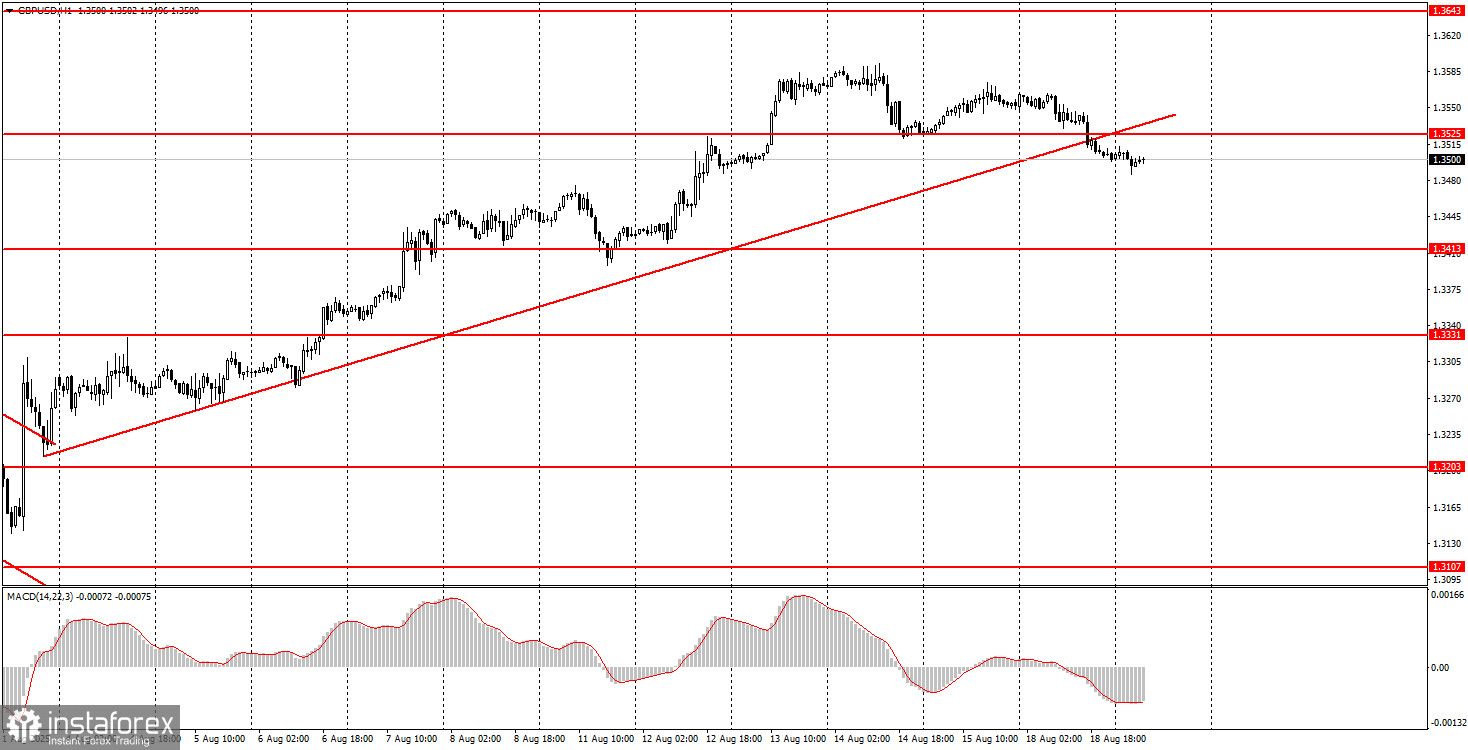
On Monday, the GBP/USD pair also traded lower and broke through its ascending trendline. After two weeks of growth, a technical correction is a natural development. The current trendline was located very close to the price, so practically any correction or pullback could have led to its break. Thus, we believe that at this point it is precisely a correction that has begun, not a shift to a downward trend. Over the past few days, nothing has changed for the U.S. dollar that would justify the formation of a full-fledged, even short-term trend. There will be very few macroeconomic reports this week, with most of the news expected to be geopolitical. So far, such information has not influenced trader sentiment. The dollar may continue a sluggish rise based on the current technical picture.
5M Chart of GBP/USD
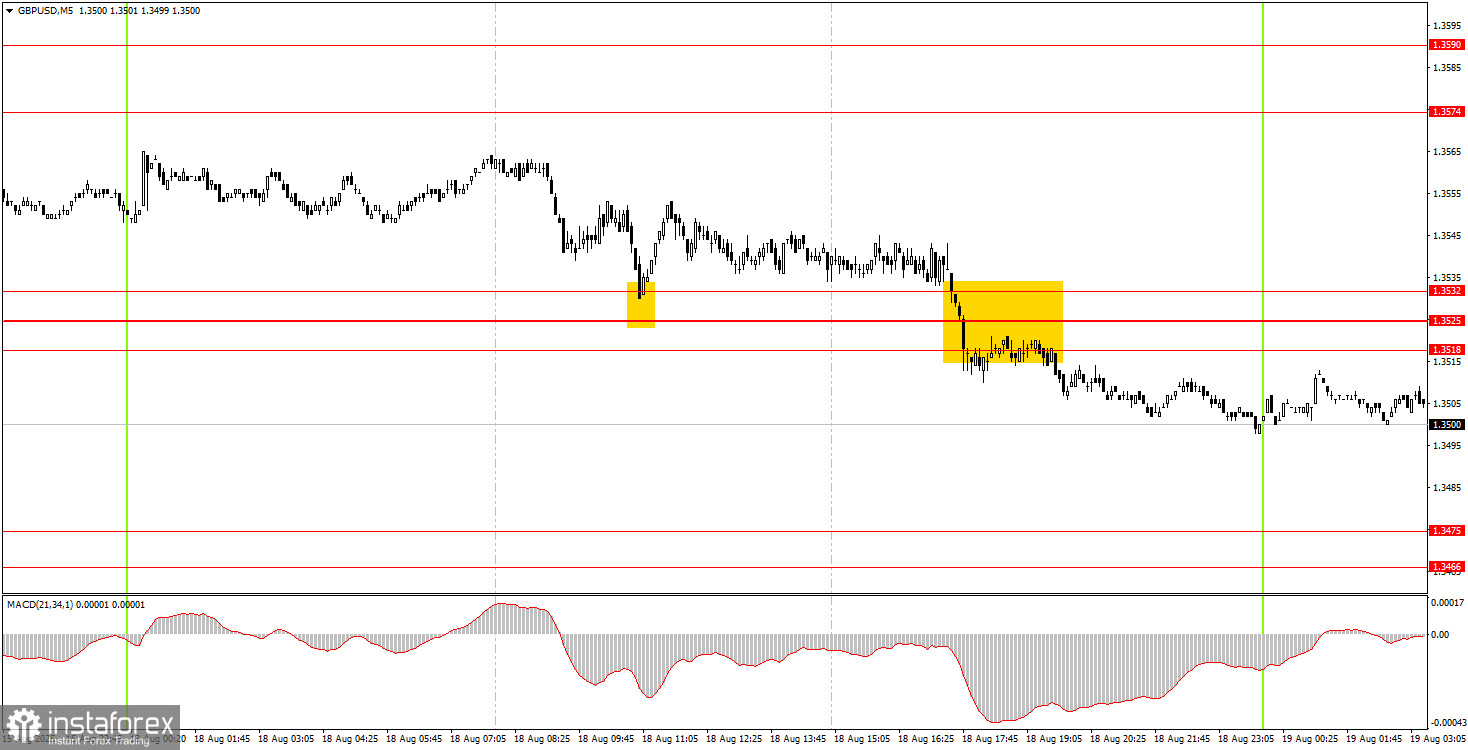
On the 5-minute timeframe, two trading signals were formed on Monday. During the European session, the price rebounded from the 1.3532 level but managed to move up only 13 pips, which was not enough even to set the Stop Loss to breakeven. During the U.S. session, the price broke through the 1.3518–1.3532 area, allowing novice traders to open short positions. These trades can be held on Tuesday with a target at 1.3466–1.3475.
Trading Strategy for Tuesday:
On the hourly timeframe, the GBP/USD pair shows signs that a new short-term downtrend could begin. We believe this will be only another correction, since the fundamental and macroeconomic background has not recently become more favorable for the dollar. Given that there will be very few macroeconomic and fundamental events this week, trading can be based on the technical picture.
On Tuesday, the GBP/USD pair may well resume upward movement, but locally it could continue to decline after breaking through the 1.3518–1.3532 area. We believe that today, traders should use local technical levels on the 5-minute timeframe to open positions.
On the 5-minute timeframe, the relevant levels for trading now are: 1.3102–1.3107, 1.3203–1.3211, 1.3259, 1.3329–1.3331, 1.3413–1.3421, 1.3466–1.3475, 1.3518–1.3532, 1.3574–1.3590, 1.3643–1.3652, 1.3682, 1.3763. For Tuesday, no significant events are scheduled in either the U.S. or the U.K., apart from U.S. construction sector data. We believe this release may provoke only a very weak market reaction, unlikely to have any significant impact.
Core Trading System Rules:
- Signal Strength: The shorter the time it takes for a signal to form (a rebound or breakout), the stronger the signal.
- False Signals: If two or more trades near a level result in false signals, subsequent signals from that level should be ignored.
- Flat Markets: In flat conditions, pairs may generate many false signals or none at all. It's better to stop trading at the first signs of a flat market.
- Trading Hours: Open trades between the start of the European session and the middle of the US session, then manually close all trades.
- MACD Signals: On the hourly timeframe, trade MACD signals only during periods of good volatility and a clear trend confirmed by trendlines or trend channels.
- Close Levels: If two levels are too close (5–20 pips apart), treat them as a support or resistance zone.
- Stop Loss: Set a Stop Loss to breakeven after the price moves 20 pips in the desired direction.
Key Chart Elements:
Support and Resistance Levels: These are target levels for opening or closing positions and can also serve as points for placing Take Profit orders.
Red Lines: Channels or trendlines indicating the current trend and the preferred direction for trading.
MACD Indicator (14,22,3): A histogram and signal line used as a supplementary source of trading signals.
Important Events and Reports: Found in the economic calendar, these can heavily influence price movements. Exercise caution or exit the market during their release to avoid sharp reversals.
Forex trading beginners should remember that not every trade will be profitable. Developing a clear strategy and practicing proper money management are essential for long-term trading success.


