


Trend Analysis (Fig. 1).
On Wednesday, from the level of 1.1645 (yesterday's daily close), the market may continue moving downward toward the target of 1.1600 – the 38.2% retracement level (blue dotted line). Upon testing this level, a price rebound upward is possible toward 1.1640 – the 61.8% retracement level (yellow dotted line).
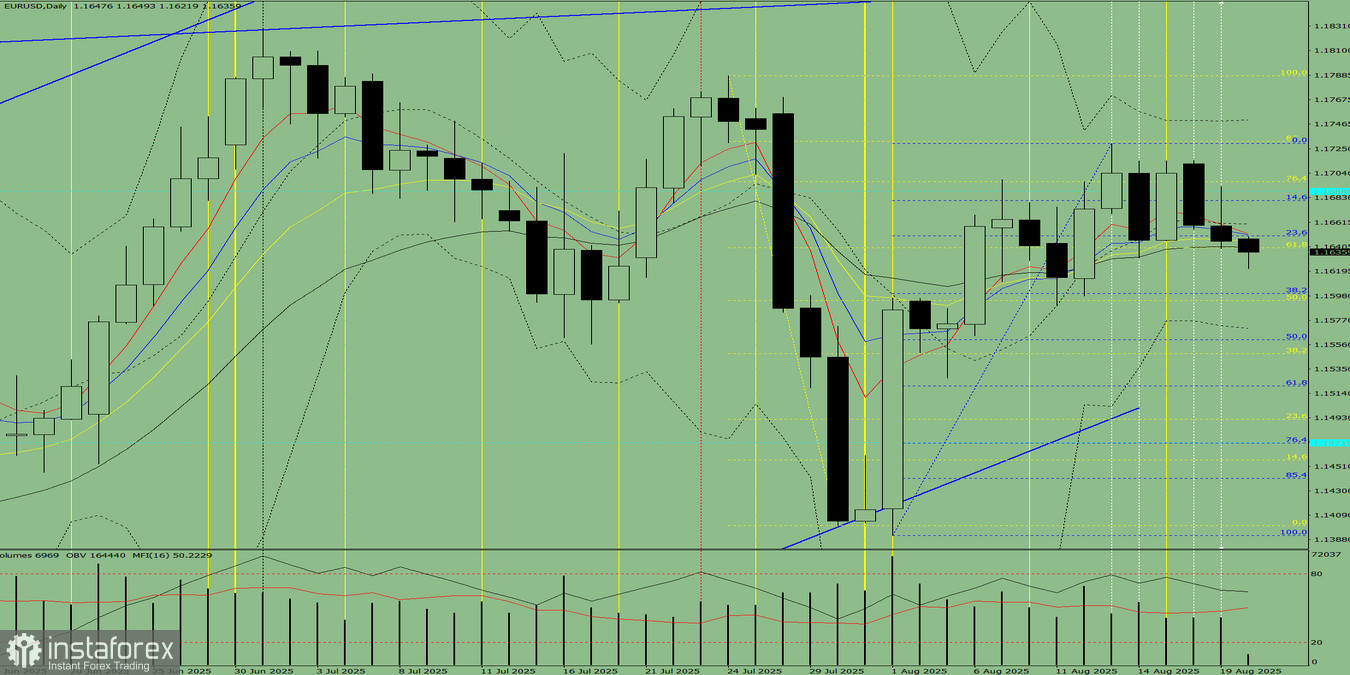
Fig. 1 (daily chart).
Comprehensive Analysis:
- Indicator analysis – downward;
- Fibonacci levels – downward;
- Volumes – downward;
- Candlestick analysis – downward;
- Trend analysis – downward;
- Bollinger Bands – downward;
- Weekly chart – downward.
Overall conclusion: bearish trend.
Alternative scenario: From the level of 1.1645 (yesterday's daily close), the price may continue moving downward toward the target of 1.1560 – the 50% retracement level (blue dotted line). Upon testing this level, a price rebound upward is possible toward 1.1594 – the 50% retracement level (yellow dotted line).


