


On Tuesday, the EUR/USD pair first rebounded from the support level of 1.1637–1.1645, and then from the 76.4% retracement level – 1.1695. On Wednesday morning, the pair consolidated below the 1.1637–1.1645 level, which allows us to expect some decline toward the next 50.0% Fibonacci level – 1.1590. However, consolidation of the pair above the 1.1637–1.1645 level will work in favor of the European currency and some growth toward 1.1695. In recent weeks, the movement has been very similar to a sideways trend.
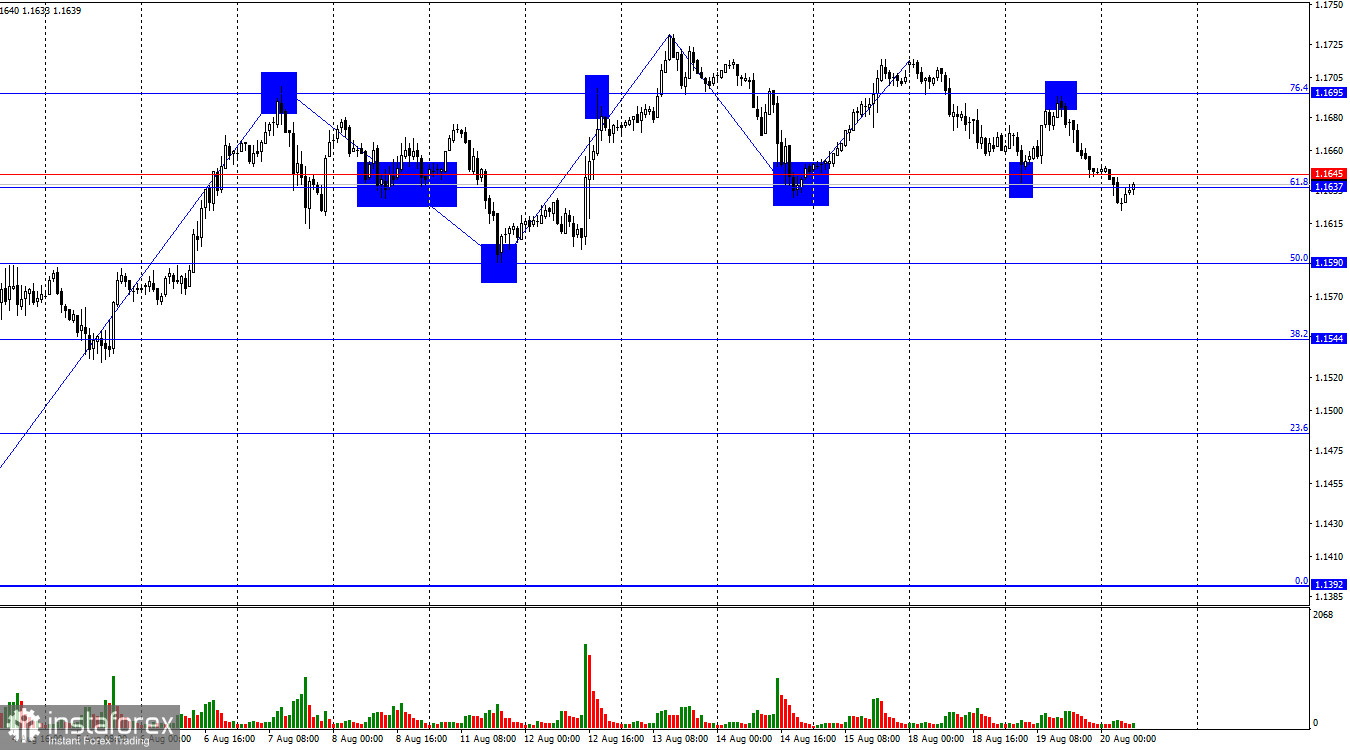
The wave structure on the hourly chart remains simple and clear. The last completed upward wave did not break the high of the previous wave, while the last downward wave did not break the previous low. Thus, for now, the trend can still be considered "bullish." The latest labor market data and the changing outlook for Fed monetary policy support bullish traders.
On Tuesday, the news background was once again absent. No updates came from the White House, and there were no economic publications. The entire current week is turning out to be extremely boring, which explains the low trader activity. Thursday will be the first interesting day, as tomorrow the Eurozone, the UK, and the US will release PMI indices in the services and manufacturing sectors for August. These are preliminary estimates, which are of the greatest interest to traders. Although these are not the most important indicators for any economy, there are no other publications this week.Therefore, I expect the first interesting moves this week no earlier than tomorrow. Friday will also be quite uneventful, but at the end of the week Jerome Powell will speak at Jackson Hole. It is unclear what stance Powell will take one month before the decisive FOMC meeting. Economists cannot agree on what the Fed chair will focus more on: labor market weakness or rising inflation.
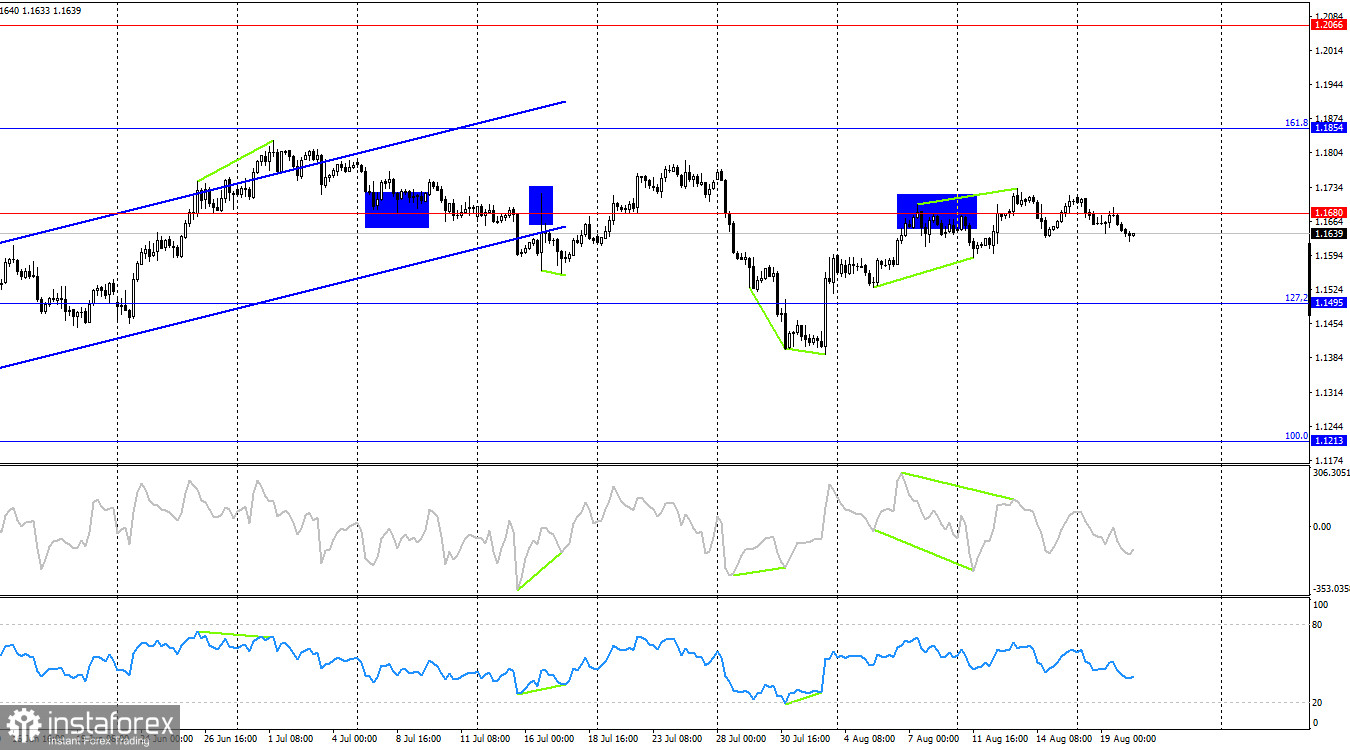
On the 4-hour chart, the pair made a new reversal in favor of the US currency and consolidated below the 1.1680 level. This level has been crossed very often lately, so I would not advise relying on it. The picture on the hourly chart is much more informative and clear. No forming divergences are observed today on any indicator.
Commitments of Traders (COT) Report:
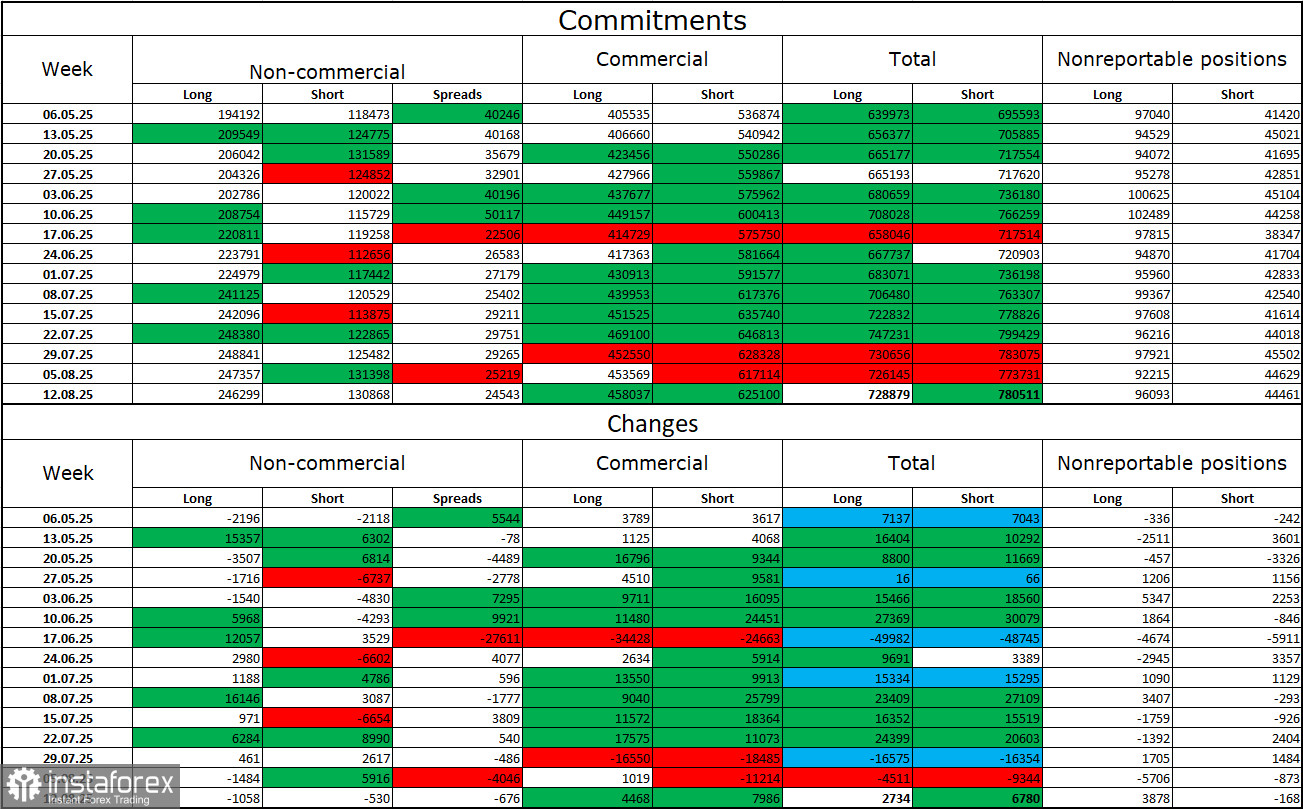
During the last reporting week, professional players closed 1,058 long positions and 530 short positions. The sentiment of the "Non-commercial" group remains "bullish" thanks to Donald Trump and is strengthening over time. The total number of long positions held by speculators now amounts to 246,000, while short positions total 131,000. The gap is nearly twofold. In addition, note the number of green cells in the table above. They show strong position-building in the euro. In most cases, interest in the euro is only increasing, while interest in the dollar is falling.
For twenty-seven weeks in a row, large players have been reducing short positions and building long ones. Donald Trump's policy remains the most significant factor for traders, as it can cause many problems of a long-term and structural nature for America. Despite the signing of several important trade agreements, some key economic indicators continue to show decline.
News calendar for the US and Eurozone:
Eurozone – Consumer Price Index (09:00 UTC).
On August 20, the economic calendar contains one release, which holds no interest for traders. The influence of the news background on market sentiment on Wednesday may be very weak or absent altogether.
EUR/USD forecast and trader advice:
Sales of the pair were possible on a rebound from the 1.1695 level on the hourly chart with targets at 1.1637–1.1645 and 1.1590. The first target was reached. Today, selling is possible if the pair closes below the 1.1637–1.1645 zone. Buying can be considered if the pair closes above the 1.1637–1.1645 zone on the hourly chart with targets at 1.1695 and 1.1789.
The Fibonacci grids are built from 1.1789–1.1392 on the hourly chart and from 1.1214–1.0179 on the 4-hour chart.


