


Trend Analysis (Fig. 1).
On Monday, the market from the level of 1.1720 (the close of Friday's daily candle) may start moving downward with the target at 1.1680 – the 14.6% retracement level (blue dotted line). Upon reaching this level, an upward movement may follow with the target at 1.1730 – the upper fractal (blue dotted line).
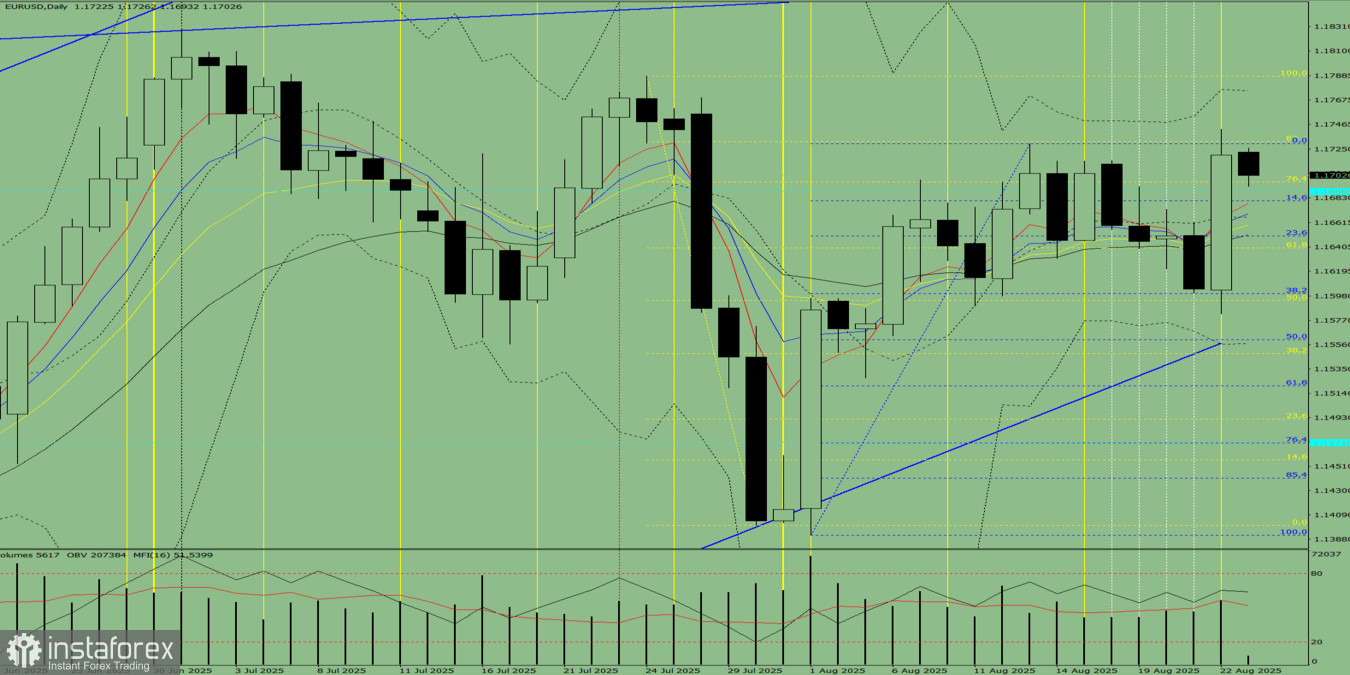
Fig. 1 (daily chart).
Comprehensive Analysis:
- indicator analysis – downward;
- Fibonacci levels – downward;
- volumes – downward;
- candlestick analysis – downward;
- trend analysis – upward;
- Bollinger Bands – downward;
- weekly chart – downward.
Overall conclusion: downward trend.
Alternative Scenario: From the level of 1.1720 (the close of Friday's daily candle), the price may begin a downward movement with the target at 1.1650 – the 23.6% retracement level (blue dotted line). Upon reaching this level, a corrective upward movement is possible with the target at 1.1680 – the 14.6% retracement level (blue dotted line).


