


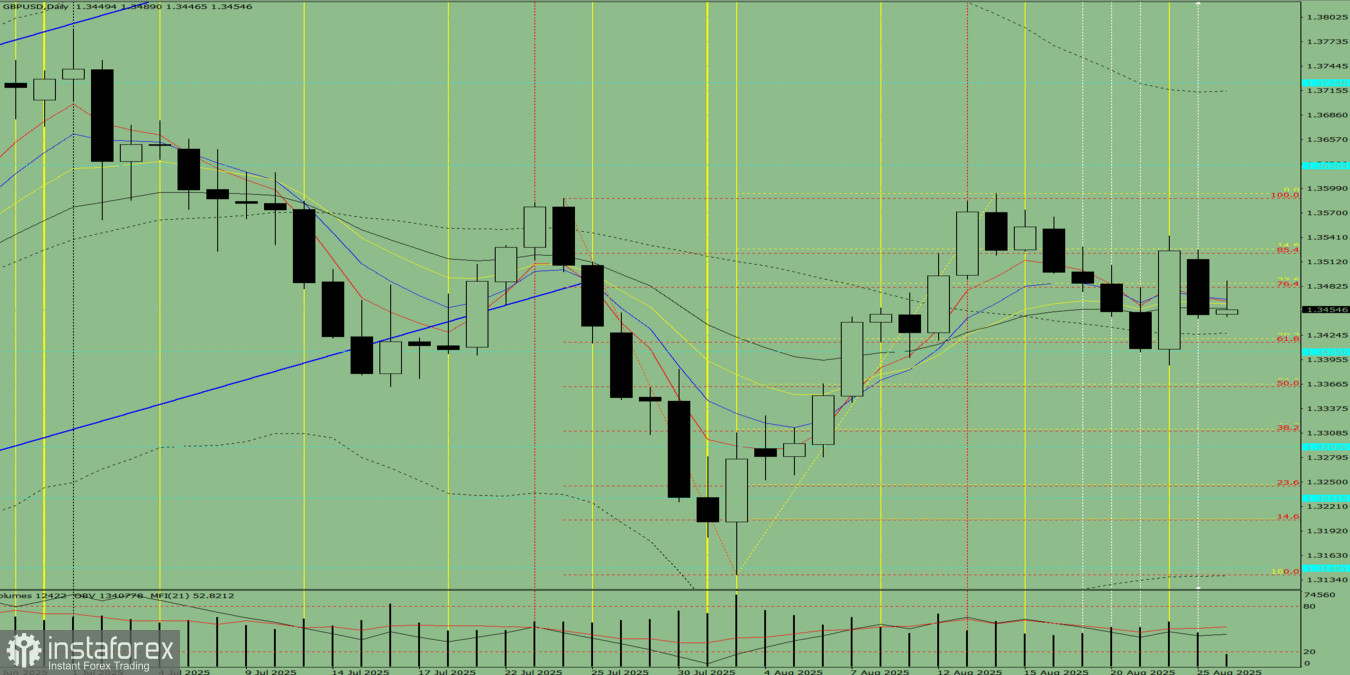
Trend Analysis (Fig. 1).
On Tuesday, from the level of 1.3449 (yesterday's daily close), the market may continue moving downward toward 1.3405 – the historical support level (blue dotted line). Upon testing this level, the price may begin moving upward toward 1.3420 – the 38.2% retracement level (yellow dotted line).
Comprehensive Analysis:
- indicator analysis – downward;
- volumes – downward;
- candlestick analysis – downward;
- trend analysis – downward;
- Bollinger Bands – downward;
- weekly chart – downward.
General Conclusion: Downward trend.
Alternative Scenario: From the level of 1.3449 (yesterday's daily close), the price may continue moving downward toward 1.3363 – the 50% retracement level (red dotted line). Upon testing this level, the price may then begin moving upward toward 1.3405 – the historical support level (blue dotted line).


