


Trend Analysis (Fig. 1).
On Wednesday, the market may start moving down from the level of 1.1641 (yesterday's daily candle close), targeting 1.1594 – the 50% retracement level (yellow dashed line). Upon testing this level, the price may rebound upward, targeting 1.1643 – the 13-day EMA (thin yellow line).
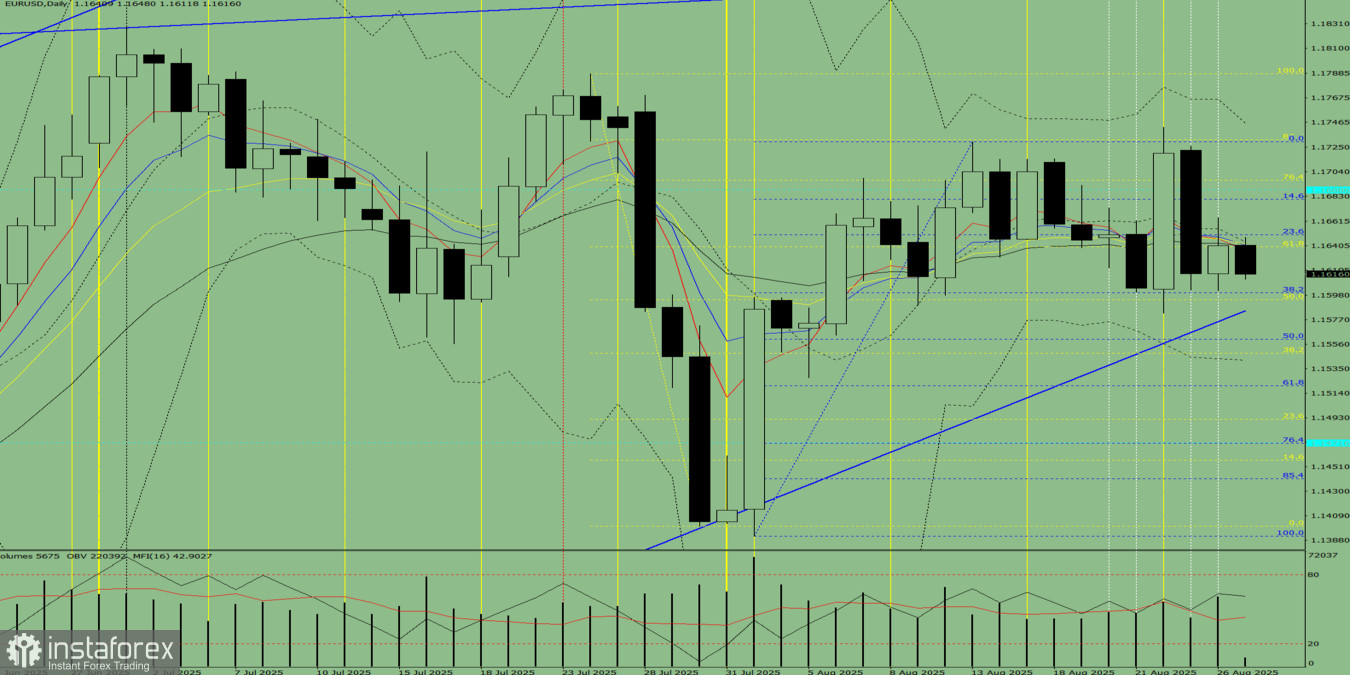
Fig. 1 (daily chart).
Comprehensive Analysis:
- Indicator analysis – downward;
- Fibonacci levels – downward;
- Volumes – downward;
- Candlestick analysis – downward;
- Trend analysis – downward;
- Bollinger Bands – downward;
- Weekly chart – downward.
Overall conclusion: downward trend.
Alternative Scenario: From the level of 1.1673 (yesterday's daily candle close), the price may start moving down, targeting 1.1560 – the 50% retracement level (blue dashed line). Upon testing this level, the price may rebound upward, targeting 1.1584 – the resistance line (bold blue line).


