


On Wednesday, the GBP/USD currency pair also traded with a slight decline, which may seem puzzling. However, in the EUR/USD article, we have already attempted to explain why many moves on the currency market cannot be fundamentally or macroeconomically justified. The mistake many analysts and traders make is trying to justify every 50-pip movement with fundamentals, forgetting that not every price change is driven by news. Forex market participants make transactions not only when news or reports are released. The currency market exists to provide access to the currencies needed for trade. Imagine a major bank needs hundreds of millions in euros. It's unlikely they'll wait for perfect fundamentals to buy that much. And they almost certainly won't form such a big position in just 15 minutes. As a result, the euro exchange rate may fall for an extended period, then suddenly soar upward. The rate may rise the entire time the large bank is building its position, while to smaller traders, the movement will seem inexplicable. So remember—not every move on the market can or should be explained.
The same applies to explaining any action taken by Donald Trump. Yesterday, it was announced that the US president has decided to raise import tariffs on India to 50%. The reason? India's refusal to halt its purchases of Russian energy. Here, most analysts may repeat the same mistake as with explanations of market movements. Many probably think Trump really wants to end the war in Ukraine, and that India buying Russian oil is in some way funding the war, letting Moscow continue combat actions. From our point of view, that's not the case.
Trump surely realizes that hundreds of sanctions against Moscow have not stopped the war, haven't destroyed the Russian economy, and generally haven't achieved much. The global economy can't do without oil, gas, and other energy. So, whether you sanction or not, countries will buy oil and gas regardless. If Russia offers reasonable prices on energy in its region, neighboring countries will buy from Russia.
Trump wants the opposite. He doesn't want India to stop buying Russian oil. He wants India to buy US oil! Trump wants to sell as much as possible, to keep dollars flowing into the US Treasury. If you don't want to buy US goods, you'll pay tariffs, filling the Treasury another way. So, as always, it all boils down to money. Remember the deal Trump signed with the EU? Brussels agreed to invest several hundred billion dollars in the US economy and to spend a similar amount on American energy. Trump is a businessman; he wants to sell. That is his whole policy.
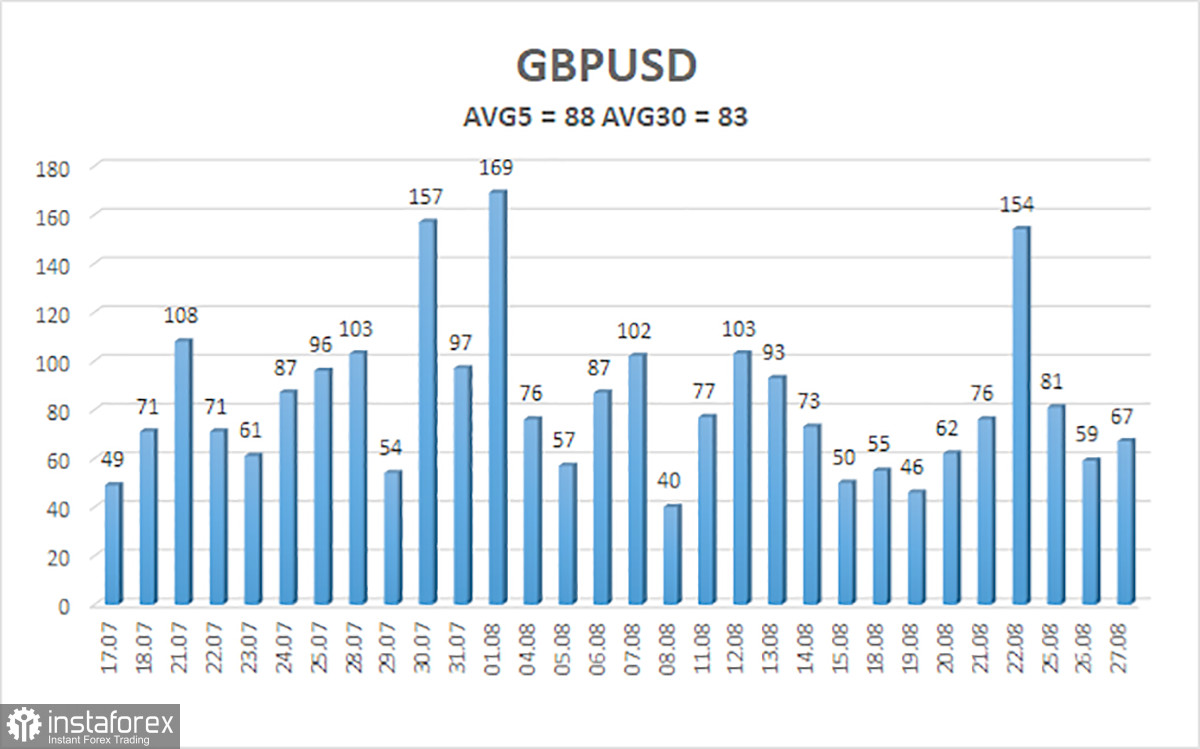
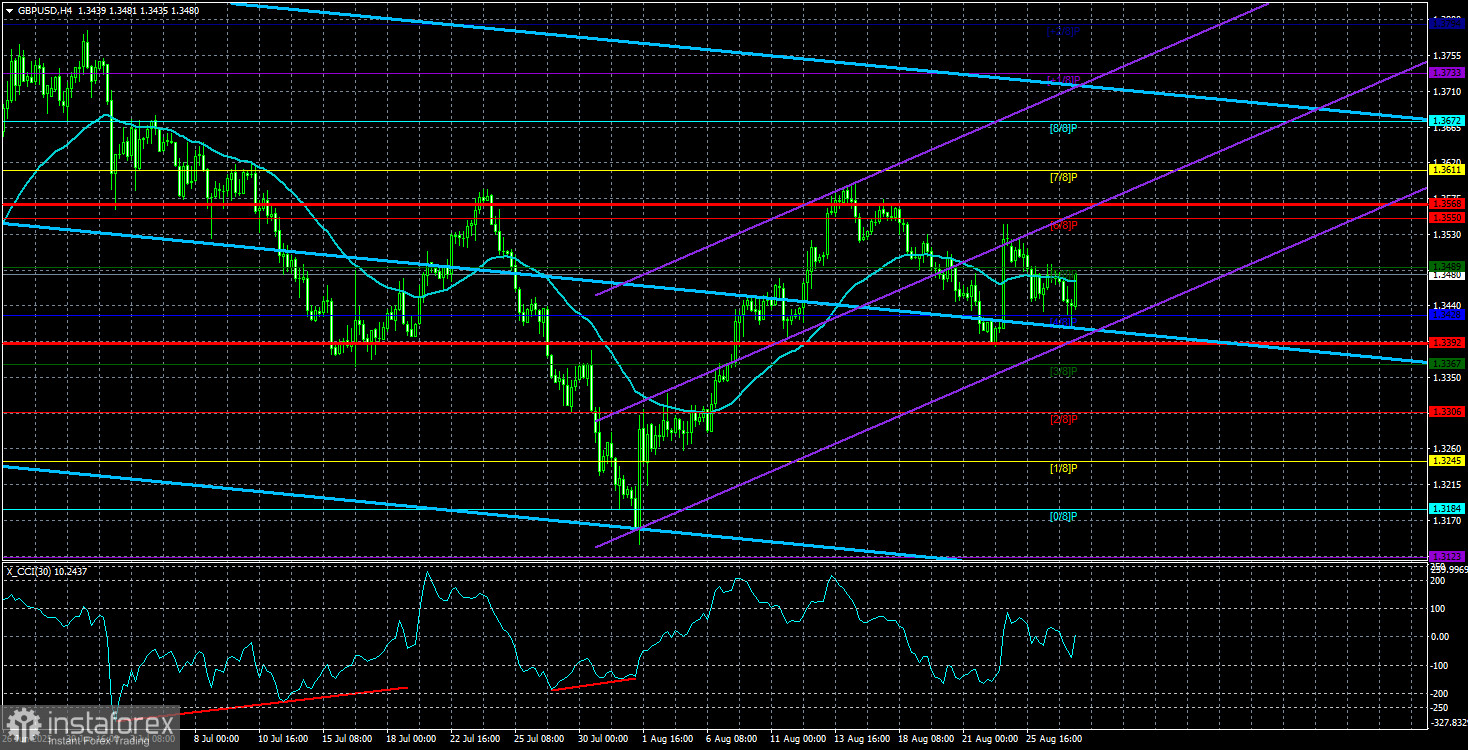
The average volatility for GBP/USD over the last five trading days is 88 pips—this is "average" for the pound/dollar pair. On Thursday, August 28, we thus expect movement within the range set by 1.3392 and 1.3568. The upper linear regression channel points upward, indicating a clear uptrend. The CCI indicator twice entered oversold territory, signaling the resumption of an uptrend. Also, before the start of the new growth wave, several bullish divergences formed.
Nearest Support Levels:
S1 – 1.3428
S2 – 1.3367
S3 – 1.3306
Nearest Resistance Levels:
R1 – 1.3489
R2 – 1.3550
R3 – 1.3611
Trading Recommendations:
The GBP/USD pair has completed another downward corrective cycle. In the medium term, Trump's policies are likely to continue putting pressure on the dollar. Therefore, long positions with targets of 1.3611 and 1.3672 remain much more relevant as long as the price is above the moving average. If the price is below the moving average, small short positions with a technical target of 1.3392 are possible. Occasionally, the US dollar will exhibit corrective moves, but for an actual trend reversal, it would require genuine signs that the global trade war is over.
Chart Elements Explained:
- Linear regression channels help determine the current trend. If both channels point in the same direction, the trend is strong.
- The moving average line (settings 20,0, smoothed) indicates the short-term trend and trade direction.
- Murray levels serve as target levels for moves and corrections.
- Volatility levels (red lines) are the likely price channel for the next day, based on current volatility readings.
- The CCI indicator: dips below -250 (oversold) or rises above +250 (overbought) mean a trend reversal may be near.


