


Trend Analysis.
In September, from the level of 1.1685 (close to the August monthly candle), the price may begin a downward movement targeting 1.1438 – retracement level 23.6% (yellow dotted line). From this level, a corrective upward move is possible, with a target at 1.1504 – historical resistance level (blue dotted line).
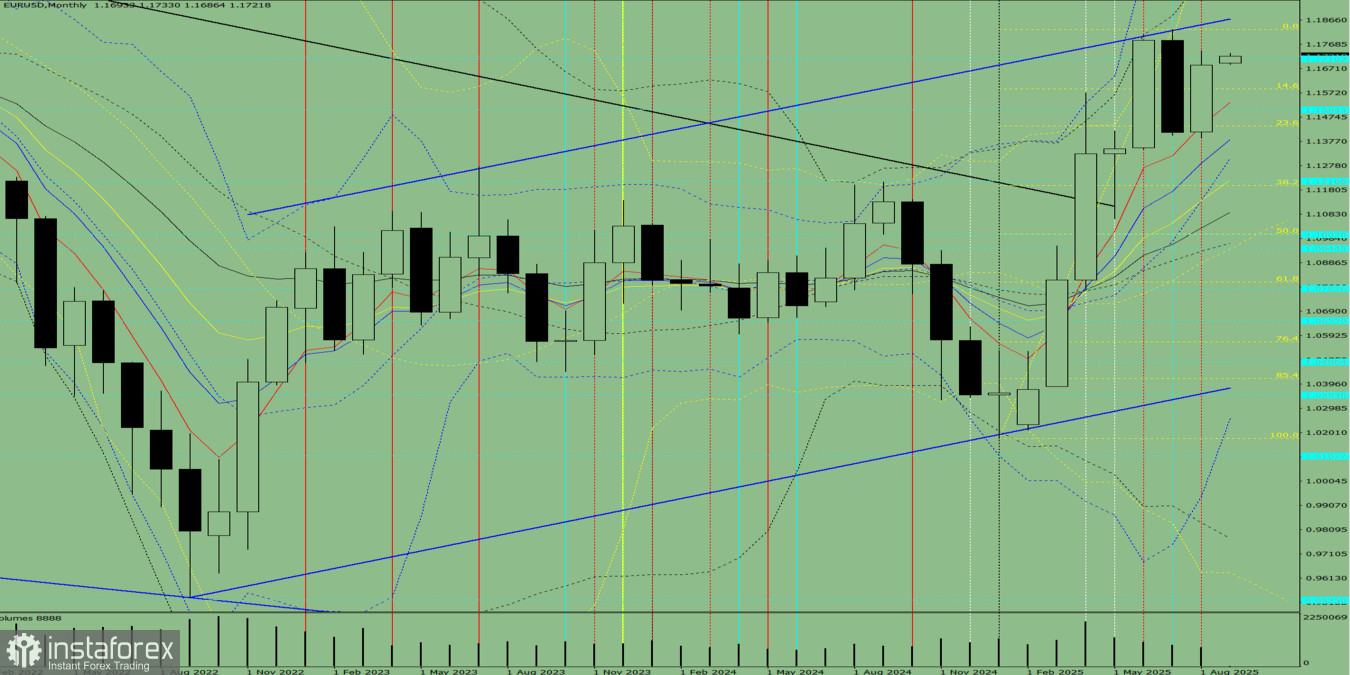
Fig. 1 (monthly chart).
Indicator Analysis:
- Indicator analysis – down;
- Fibonacci levels – down;
- Volumes – down;
- Candlestick analysis – down;
- Trend analysis – down;
- Bollinger Bands – down.
Conclusion from comprehensive analysis: a downward trend is possible.
Overall monthly outlook for the EUR/USD candle on the monthly chart: the price will most likely show a downward trend, with no initial upper shadow on the monthly black candle (first week of the month – black) and with a lower shadow present (last week of the month – white).
Alternative scenario: from the level of 1.1685 (close of the August monthly candle), the price may start moving downward toward 1.1504 – historical resistance level (blue dotted line). From this level, the market may then move upward with a target at 1.1588 – historical resistance level (blue dotted line).


