


Trend Analysis (Fig. 1).
On Tuesday, the market, from the level of 1.1710 (yesterday's daily close), may continue moving downward, targeting 1.1659 – the 23.6% retracement level (blue dotted line). Upon testing this level, the price may possibly rebound upward, aiming to test the 13-period EMA at 1.1668 (thin yellow line).
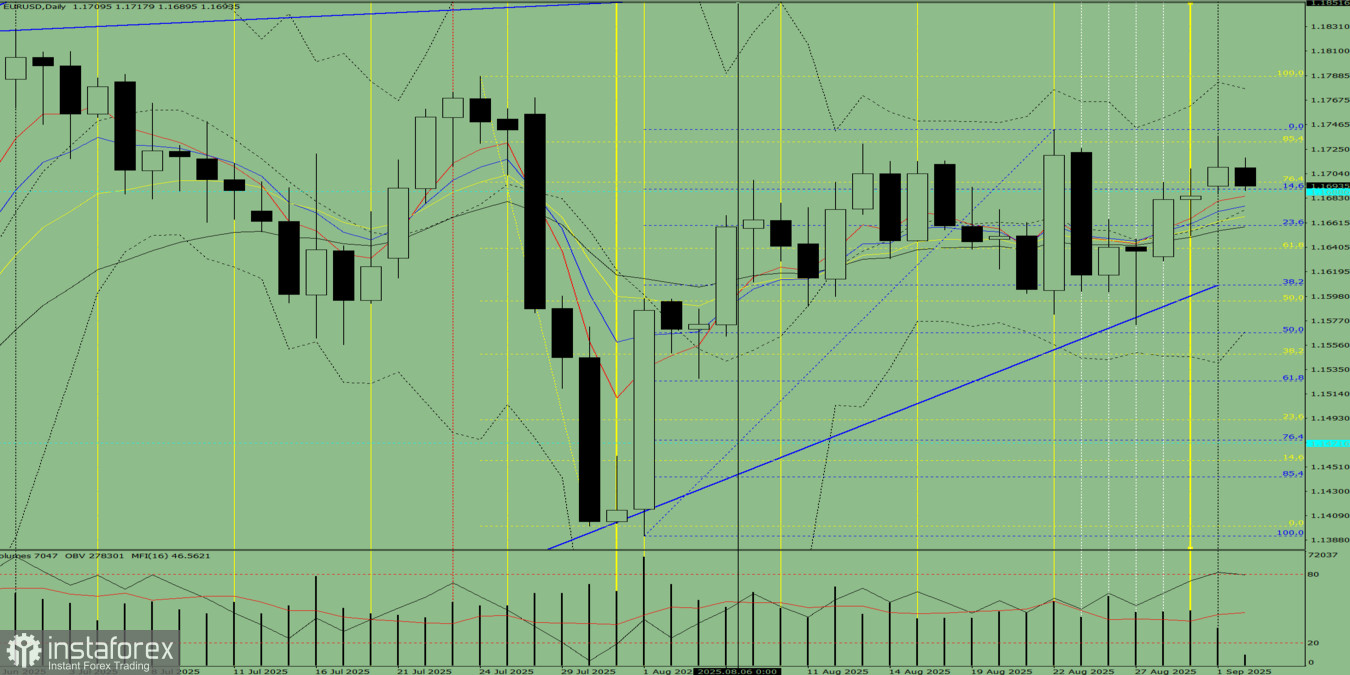
Fig. 1 (daily chart).
Comprehensive Analysis:
- Indicator analysis – down;
- Volumes – down;
- Candlestick analysis – down;
- Trend analysis – down;
- Bollinger Bands – down;
- Weekly chart – down.
Overall conclusion: downward trend.
Alternative scenario: From the level of 1.1710 (yesterday's daily close), the price may continue downward toward 1.1640 – the 61.6% retracement level (yellow dotted line). Upon testing this level, the price may possibly rebound upward, aiming to test the 23.6% retracement level at 1.1659 (blue dotted line).


