


EUR/USD 5-Minute Analysis
On Tuesday, the EUR/USD currency pair plummeted like a stone for reasons that remain unexplained to this day. Some analysts have already put forward hypotheses about what happened in the market on September 2. However, the vast majority of these ideas aren't worth a dime. We just have to admit the obvious—something happened, and precisely what, we may never know. In any case, a rather important and interesting macroeconomic background was ignored. The Eurozone inflation report came out an hour after the crash began, and its value actually supported the euro. The U.S. ISM Manufacturing PMI came in worse than forecast, yet for most of the day the dollar rose sharply.
And even after such a completely crazy Tuesday, the EUR/USD pair remains inside the sideways (flat) channel. In technical terms, nothing has changed for EUR/USD. The flat continues, and there is still no trending movement. Maybe today we'll finally find out where the issue really lies, and then forecasting the pair's next move will become a bit easier. But at the moment, there is nothing to forecast. We need the flat to end.
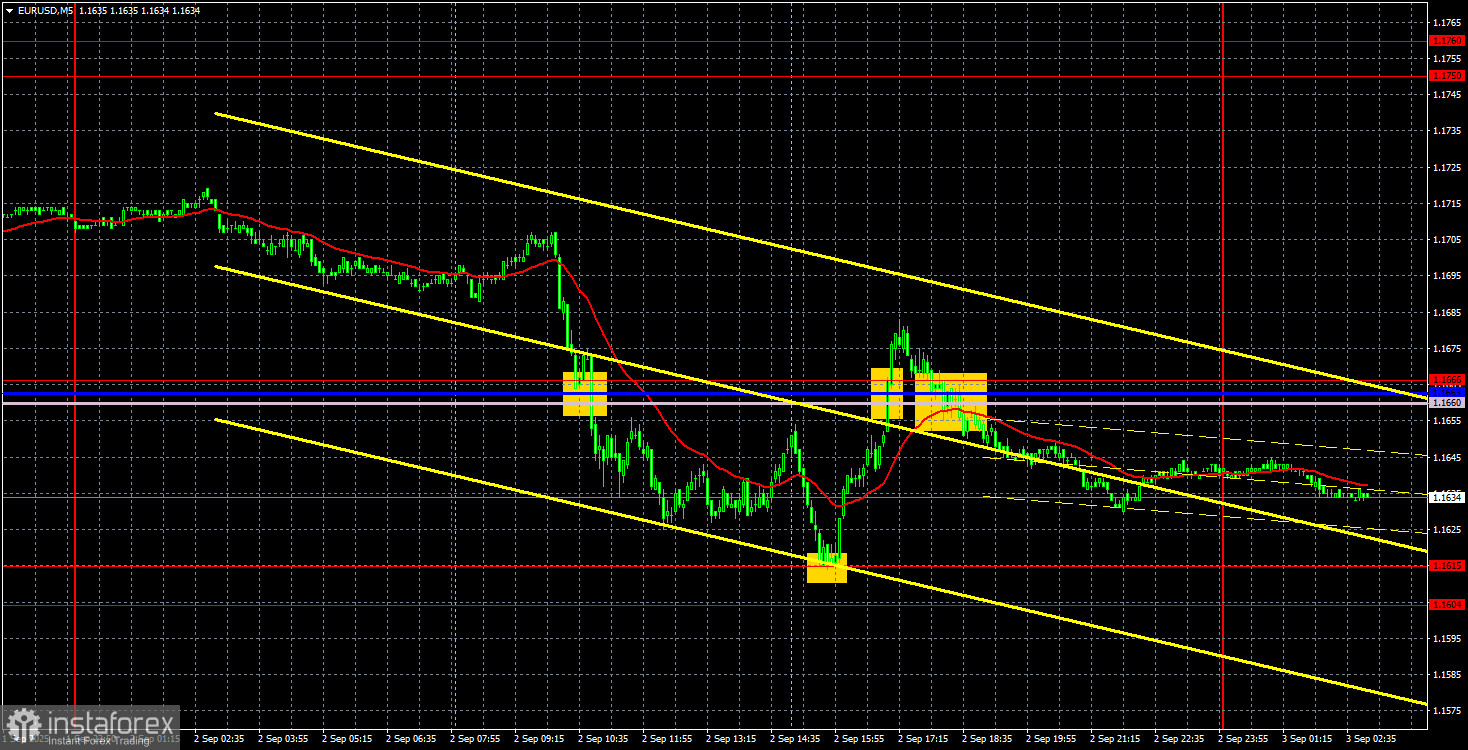
On the 5-minute chart, we highlighted all the trade signals that formed on Tuesday, but only the first two could have been worked out, and even then, only barely. If a trader doesn't understand why the price is flying (really flying, not just slowly moving) in a particular direction, it's better not to enter the market. The price broke through the 1.1660–1.1666 area, which could have been traded as a short position. However, remember that in a flat, the Ichimoku indicator lines have no value. The only more or less acceptable trading signal was the bounce from the 1.1604–1.1615 area.
COT Report
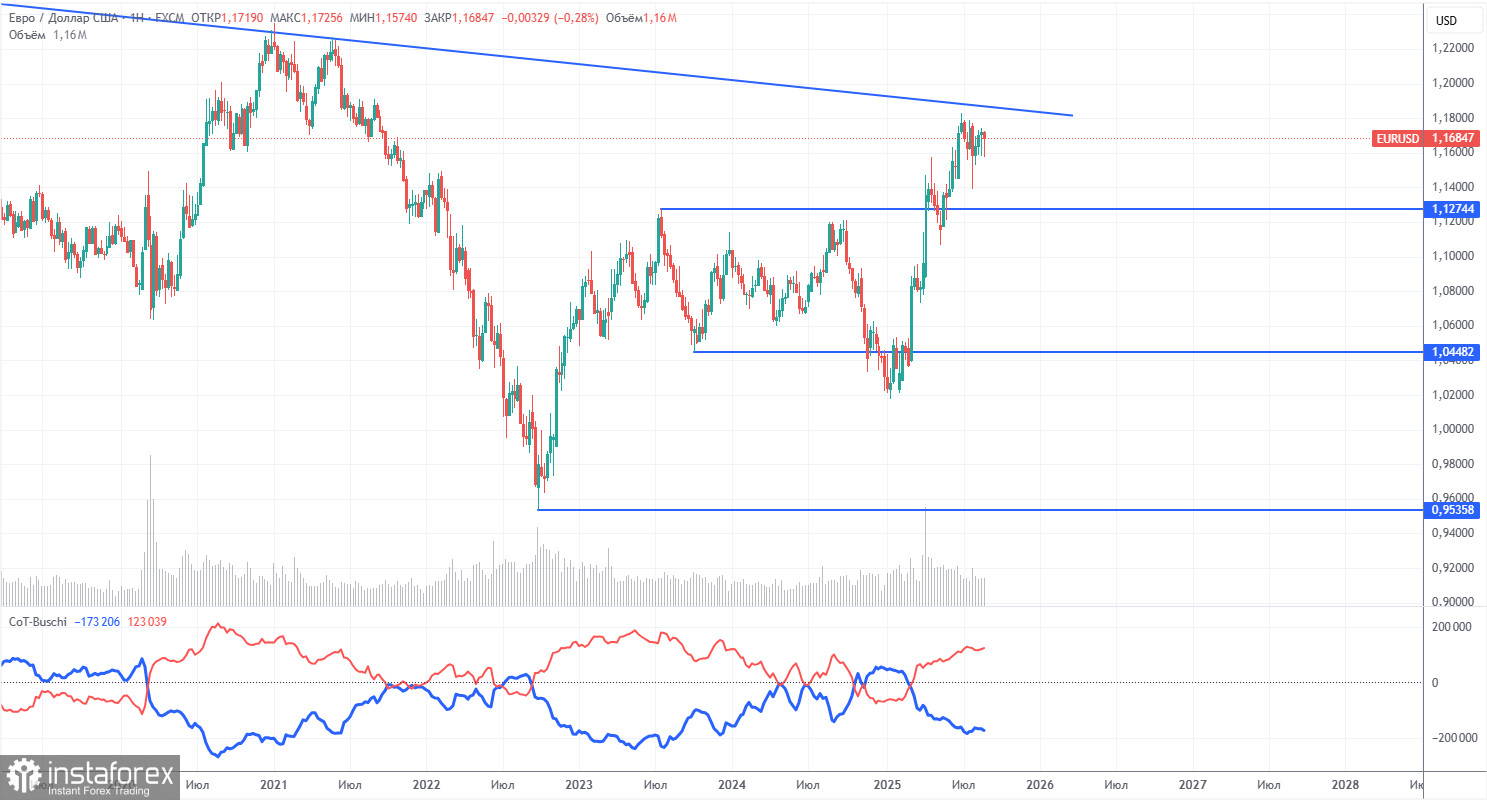
The latest COT report is dated August 26. As shown in the chart above, the net position of non-commercial traders remained bullish for a prolonged period; bears briefly gained the upper hand at the end of 2024 but quickly lost it. Since Trump became the US President, the dollar has been the only currency to decline. We can't say with 100% certainty that the US dollar will continue to fall, but current global developments seem to suggest this scenario.
We still see no fundamental factors that would strengthen the euro, while there remain plenty of factors that could lead to further dollar weakness. The global downtrend remains in place, but what does it matter that the price has moved for the last 17 years? As soon as Trump ends his trade wars, the dollar might recover, but recent events show that the war is likely to continue in one form or another. The possible loss of Fed independence is another major pressure factor for the US currency.
The positioning of the red and blue lines on the indicator continues to point to a bullish trend. In the last reporting week, long positions held by the "Non-commercial" group grew by 5,700, while short positions grew by 1,300. Accordingly, the net position increased by 4,400 contracts during the week.
EUR/USD 1-Hour Analysis
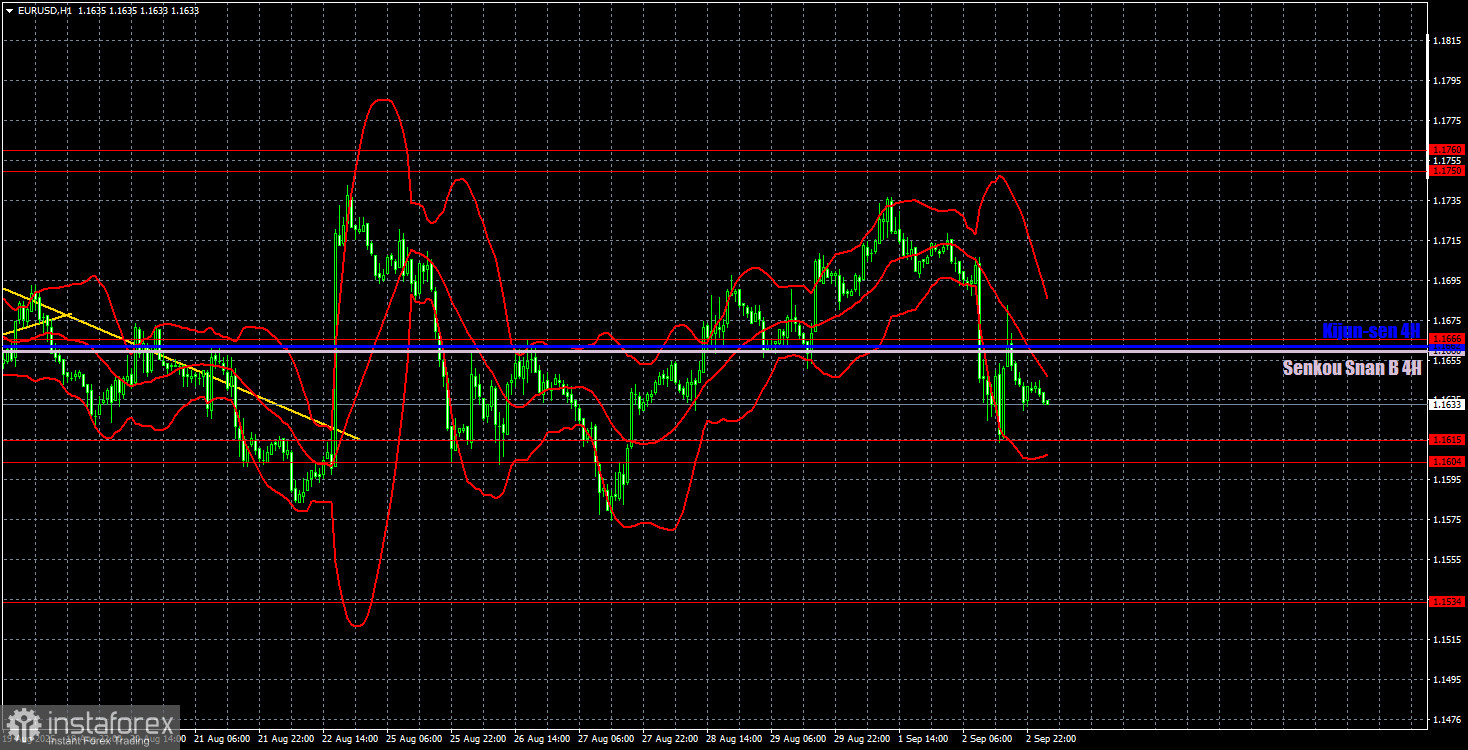
In the hourly timeframe, the EUR/USD pair made its first step toward forming a new uptrend, but for several weeks now, the market has been flat. The global factors causing the decline in the US currency that we keep mentioning have not disappeared. We still see no reason for a medium-term rise in the dollar and therefore cannot forecast its growth.
For September 3, we highlight the following levels for trading: 1.1092, 1.1147, 1.1185, 1.1234, 1.1274, 1.1362, 1.1426, 1.1534, 1.1604–1.1615, 1.1666, 1.1750–1.1760, 1.1846–1.1857, as well as Senkou Span B (1.1660) and Kijun-sen (1.1663) lines. Ichimoku indicator lines may move during the day, which should be considered when determining trading signals. Don't forget to set a Stop Loss to break even if the price moves 15 pips in the right direction—this protects against possible losses if the signal is false.
The most important event on Wednesday will be the US JOLTs Job Openings report, which is published with a two-month delay. Christine Lagarde will also speak, potentially commenting on yesterday's inflation report, which showed an increase to 2.1% y/y.
Trading Recommendations
On Wednesday, the price could move completely at random, as the pair remains flat. If the movements were as calm as before Tuesday, technical factors could be used for trading with confidence. After Tuesday, it becomes extremely difficult to predict what will happen next.
Illustration Explanations:
- Support and resistance price levels – thick red lines where movement may end. They are not trading signal sources.
- Kijun-sen and Senkou Span B lines—These are strong Ichimoku indicator lines transferred to the hourly timeframe from the 4-hour one.
- Extremum levels – thin red lines where the price has previously rebounded. These act as trading signal sources.
- Yellow lines – trend lines, trend channels, and other technical patterns.
- Indicator 1 on the COT charts – the size of the net position for each category of traders.


