


Trend analysis (Fig. 1).
On Thursday, the market from the level of 1.3440 (yesterday's daily close) may start moving downward with the target at 1.3313 – the 61.8% retracement level (yellow dotted line). From this level, the price may bounce upward with the target at 1.3367 – the 50% retracement level (yellow dotted line).
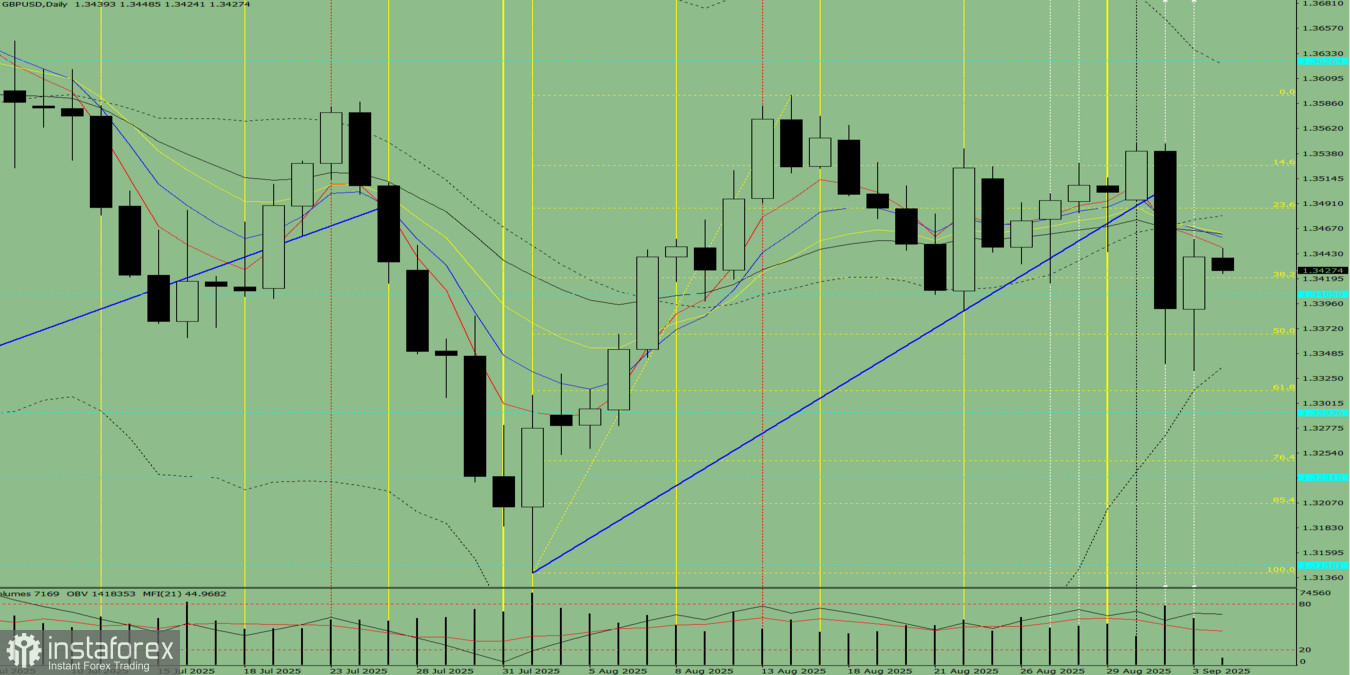
Fig. 1 (daily chart).
Comprehensive analysis:
- Indicator analysis – down;
- Fibonacci levels – down;
- Volumes – down;
- Candlestick analysis – down;
- Trend analysis – down;
- Bollinger Bands – down;
- Weekly chart – down.
Overall conclusion: downward trend.
Alternative scenario: from the level of 1.3440 (yesterday's daily close), the price may begin moving downward with the target at 1.3367 – the 50% retracement level (yellow dotted line). From this level, the price may bounce upward with the target at 1.3405 – historical resistance level (blue dotted line).


