


Trend analysis (Fig. 1).
On Friday, the market from the level of 1.1648 (yesterday's daily close) may continue moving downward with a target at 1.1608 – the 38.2% retracement level (blue dotted line). Upon testing this level, the price may rebound upward with a target at 1.1630 – the lower fractal (daily candle from September 4, 2025).
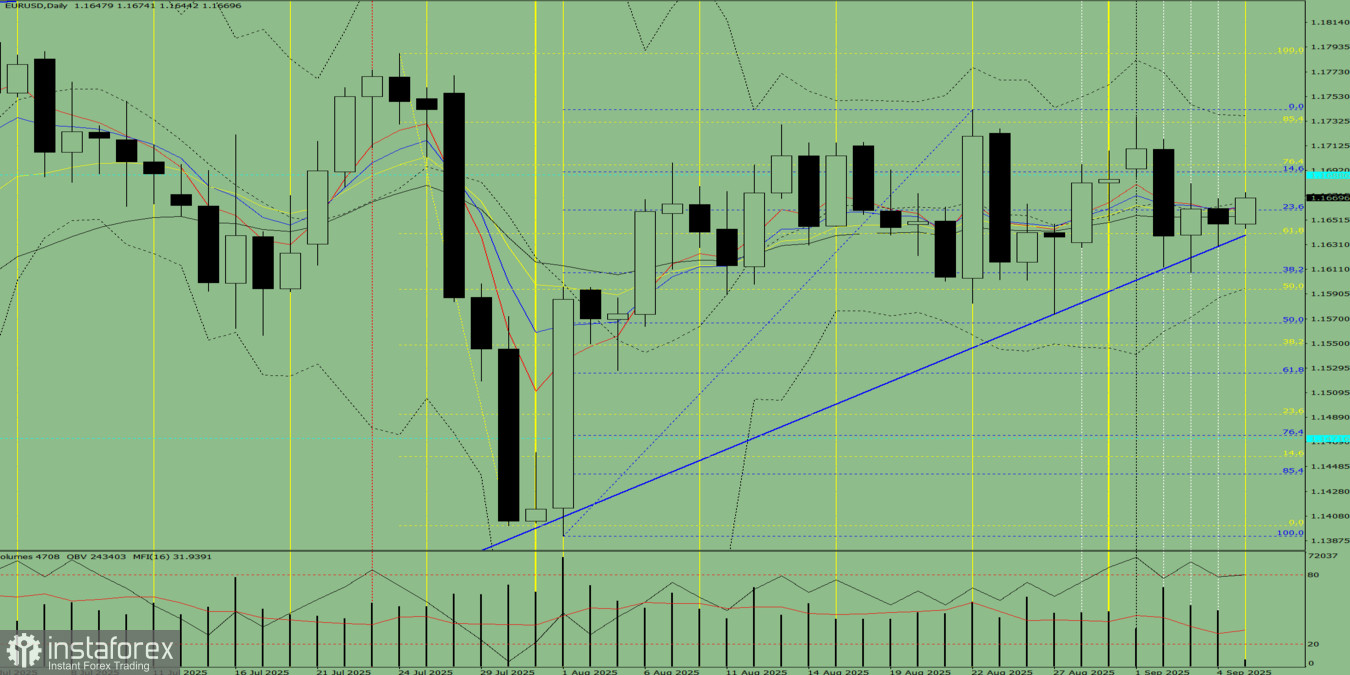
Fig. 1 (daily chart).
Comprehensive analysis:
- Indicator analysis – down;
- Fibonacci levels – down;
- Volumes – down;
- Candlestick analysis – down;
- Trend analysis – down;
- Bollinger Bands – down;
- Weekly chart – up.
Overall conclusion: downward trend.
Alternative scenario: Today, from the level of 1.1648 (yesterday's daily close), the price may start moving downward with a target at 1.1594 – the 50% retracement level (yellow dotted line). Upon testing this level, the price may rebound upward with a target at 1.1608 – the 38.2% retracement level (blue dotted line).


