


On Friday, the EUR/USD currency pair posted a relatively strong upward move, triggered, of course, by US labor market and unemployment data. A month earlier, Donald Trump lashed out at the US National Bureau of Statistics over the downward revision of Nonfarm Payrolls for June and July. It's still unclear what the Bureau and its now-former director Erica MacAnterfer were supposedly guilty of, but the August Nonfarms report proved one thing—there were no mistakes or malicious activity. The US labor market continues to "fall" as a result of Trump's policies.
All experts are convinced of this, but you don't need to be an expert to see it—just compare the obvious facts and their timing. Trump became president in January; in April, he imposed large-scale import tariffs, and in May, the labor market began to shrink. Yes, it was May—not June—when the first major drop in new jobs was recorded. In April, 158,000 new jobs were created; in May, only 19,000. What's more, the June figure was revised down again to -13,000. So, over the past four months, the US economy has created just 107,000 new jobs. For reference, before Trump, the US economy routinely created 150,000–200,000 jobs each month.
The results of Trump's policies are clear for all to see. Of course, the president keeps touting a bright future, upcoming economic growth, and a return to US greatness after Biden. But all key macroeconomic indicators are falling—even after the economy has "digested" the tariffs and all their fallout. Take, for example, the ISM Manufacturing Index—until February 2025, it grew, but has only fallen since. The ISM Services Index has stagnated below 2024 averages. Inflation began rising in April from its recent years' lows. Everywhere you look, indicators are falling, and only GDP is rising.
As many experts have said, the economy is showing artificial growth. If tariffs push up the price of goods and raw materials, then GDP rises, government revenues spike, and taxes rise too. That's why we saw strong economic growth data for Q2. But who cares about GDP growth if unemployment rises, the labor market cools, inflation climbs, business activity wanes, and investment declines?
The dollar remains the main "beneficiary" of Trump's policy—though with a minus sign. The US currency is "taking all the hits" from Trump, and it serves a purpose: Trump doesn't want a strong dollar, since he desperately wants to boost exports. For now, export growth is achieved only through "gun-to-the-head" trade deals, and even then, there aren't many new deals.
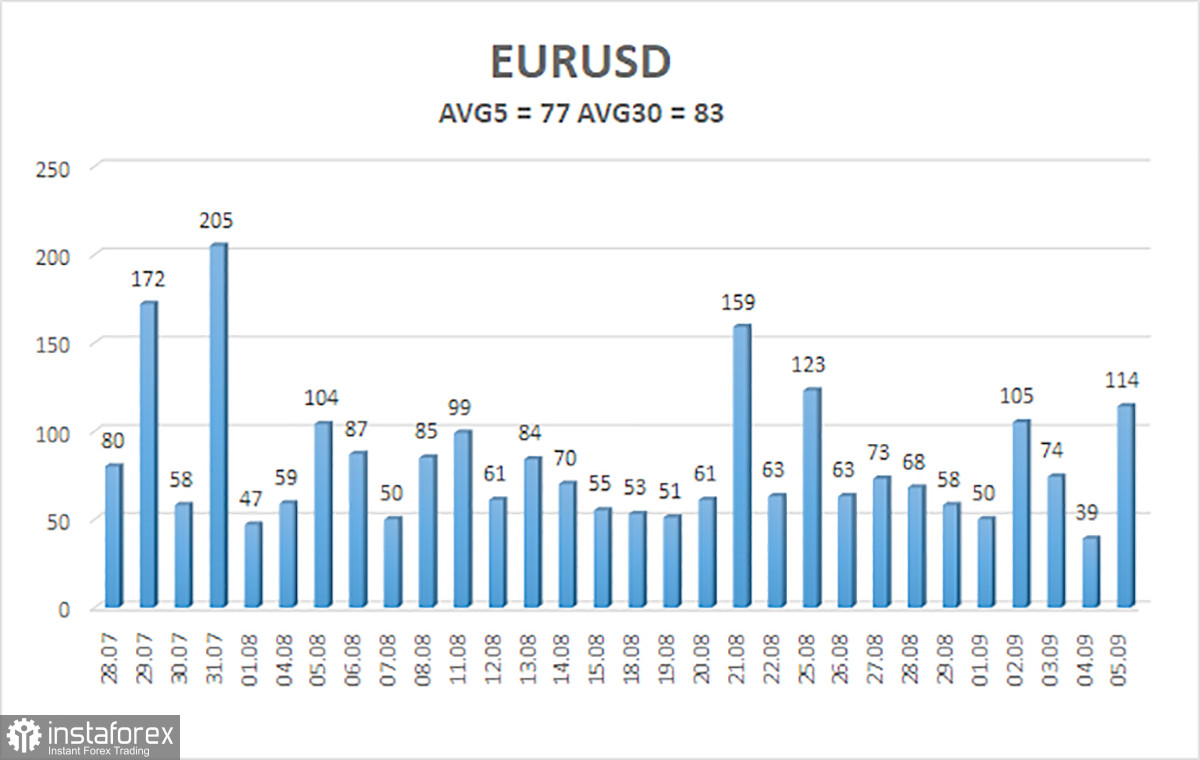
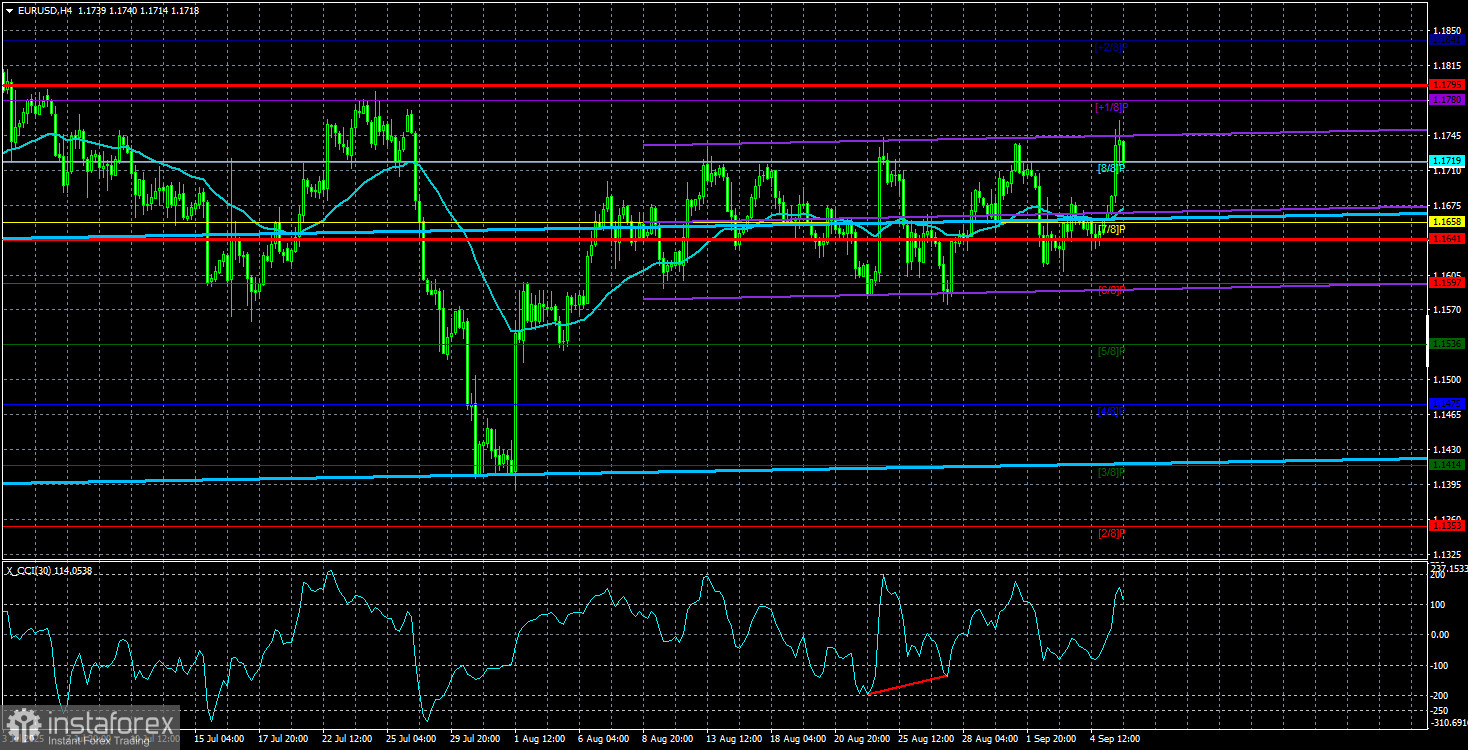
The average EUR/USD volatility for the last five trading days as of September 8 stands at 77 pips—an "average" value. For Monday, we expect movements between 1.1641 and 1.1795. The linear regression channel's upper band is upward-pointing, still indicating an uptrend. The CCI indicator dipped into oversold three times, signaling trend resumption. A bullish divergence has also formed, warning of possible growth.
Nearest Support Levels:
S1 – 1.1719
S2 – 1.1658
S3 – 1.1597
Nearest Resistance Levels:
R1 – 1.1780
R2 – 1.1841
Trading Recommendations:
The EUR/USD pair may resume its uptrend. The US dollar is still being heavily affected by Trump's policy, and he has no intention of "resting on his laurels." The dollar has risen as much as it could, but now it seems the time has come for a new, protracted decline. If the price is below the moving average, consider small shorts targeting 1.1597. If price is above the moving average, long positions toward 1.1780 and 1.1795 remain relevant for trend continuation. Currently, the market remains in a flat, bounded roughly between the Murray levels of 1.1597 and 1.1719.
Chart Elements Explained:
- Linear regression channels help determine the current trend. If both channels point in the same direction, the trend is strong.
- The moving average line (settings 20,0, smoothed) indicates the short-term trend and trade direction.
- Murray levels serve as target levels for moves and corrections.
- Volatility levels (red lines) are the likely price channel for the next day, based on current volatility readings.
- The CCI indicator: dips below -250 (oversold) or rises above +250 (overbought) mean a trend reversal may be near.


