


Natural gas has opened the new week above the key resistance level of 3.086, with the Marlin oscillator continuing to rise in positive territory. This suggests that the next target level of 3.333 (the lows from January 3 and April 9) will be reached soon. A consolidation above this level will open the way to a more significant target zone—between 3.763 and 3.815.
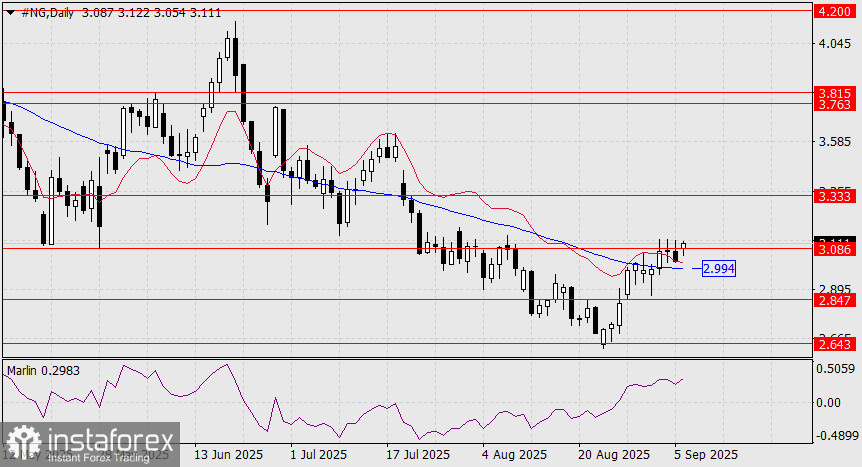
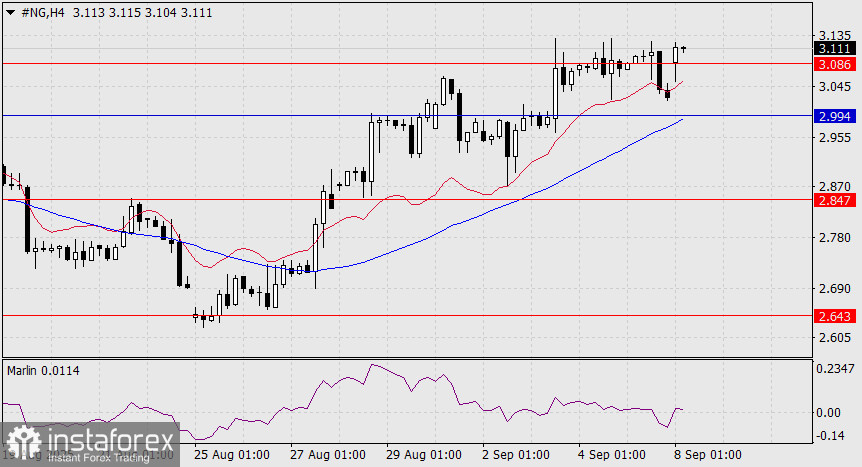
If the price falls back below the MACD line (2.994), it would drop toward the 2.847 support level. A clear move below this level could lead to a test of the 2.643 support. On the four-hour chart, the MACD line is almost identical to that on the daily chart.
Therefore, the 2.994 level is a strong support, and its break could start a move down to 2.643—unless the 2.847 level strongly halts the decline.
Currently, the setup remains bullish, as price is rising above both indicator lines and the Marlin oscillator is firmly settled in positive territory. We expect further growth in natural gas prices.


