


Trend analysis (Fig. 1).
On Monday, from the level of 1.3506 (Friday's daily candle close), the market may begin moving downward with a target of 1.3469 – the 21-day EMA (black thin line). Upon testing this line, the price may begin moving upward with a target of 1.3486 – the 23.6% retracement level (yellow dotted line).
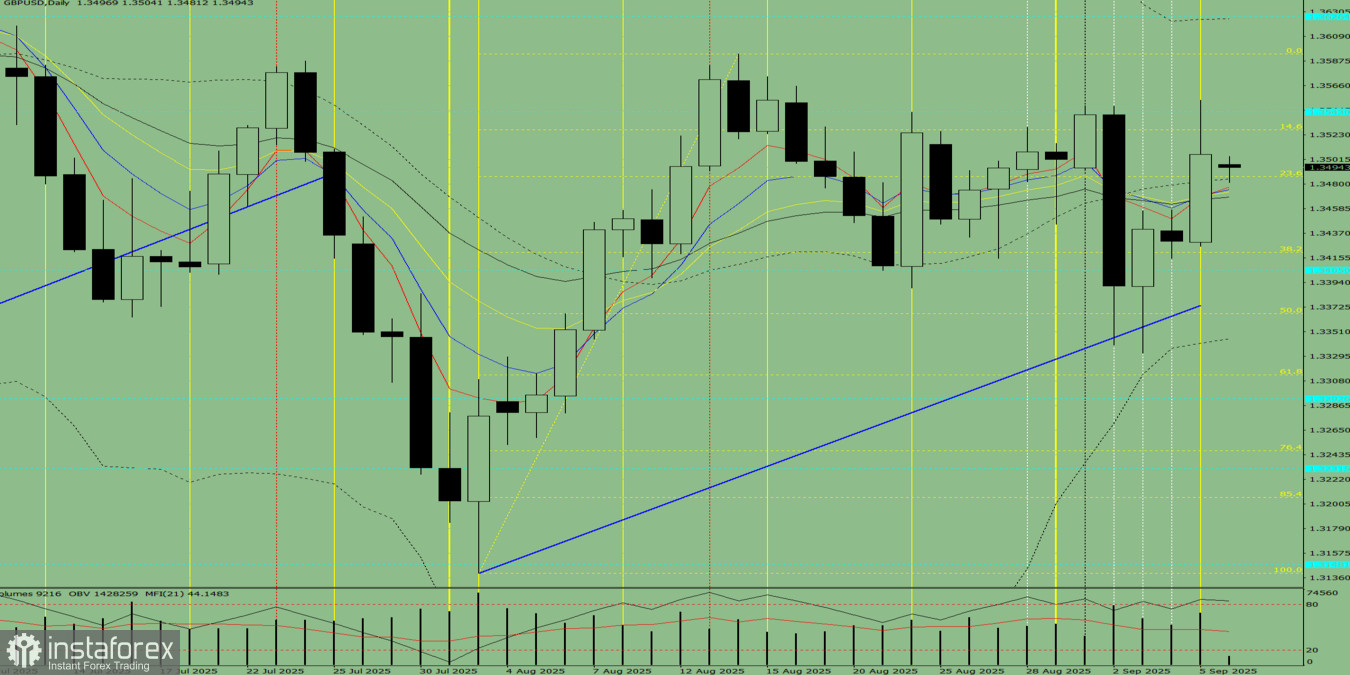
Fig. 1 (daily chart).
Comprehensive analysis:
- Indicator analysis – down;
- Fibonacci levels – down;
- Volumes – down;
- Candlestick analysis – down;
- Trend analysis – up;
- Bollinger Bands – down;
- Weekly chart – down.
Overall conclusion: Downtrend.
Alternative scenario: From the level of 1.3506 (Friday's daily candle close), the price may start moving downward with a target of 1.3420 – the 38.2% retracement level (yellow dotted line). Upon testing this level, the price may then move upward with a target of 1.3469 – the 21-day EMA (black thin line).


