


Trend Analysis (Fig. 1).
On Tuesday, from the level of 1.1752 (yesterday's daily candle close), the market may continue moving upward with the target at 1.1788 – the upper fractal (yellow dotted line). Upon testing this level, the price may retreat downward to test the upper fractal at 1.1765 (daily candle from September 8, 2025).
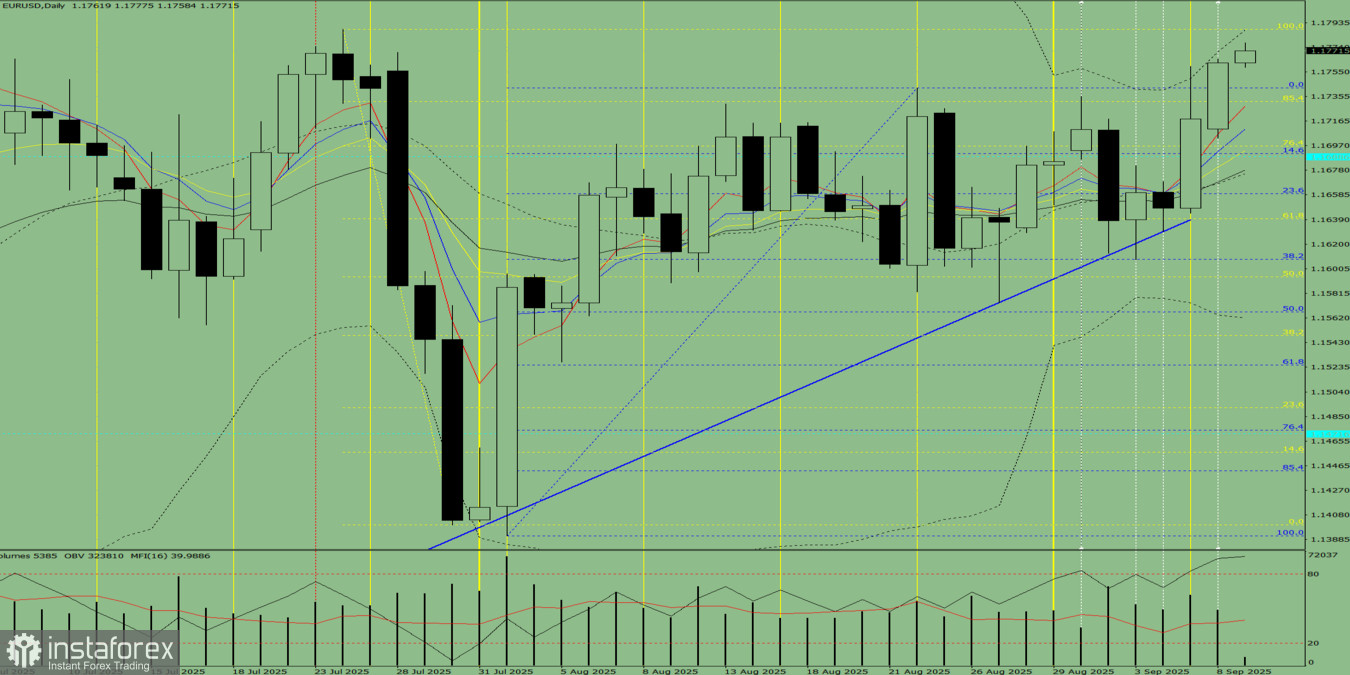
Fig. 1 (daily chart).
Comprehensive Analysis:
- Indicator analysis – up;
- Volumes – up;
- Candlestick analysis – up;
- Trend analysis – up;
- Bollinger Bands – up;
- Weekly chart – up.
Overall conclusion: upward trend.
Alternative scenario: from the level of 1.1752 (yesterday's daily candle close), the price may continue moving upward with the target at 1.1829 – the upper fractal (daily candle from July 1, 2025). Upon testing this level, the price may retreat downward to test the upper fractal at 1.1788 (yellow dotted line).


