


Trend Analysis (Fig. 1).
On Wednesday, the market may start moving upward from the 1.1707 level (yesterday's daily close) toward the target at 1.1742 – upper fractal (blue dotted line). Upon testing this level, the price may continue rising toward 1.1788 – upper fractal (yellow dotted line).
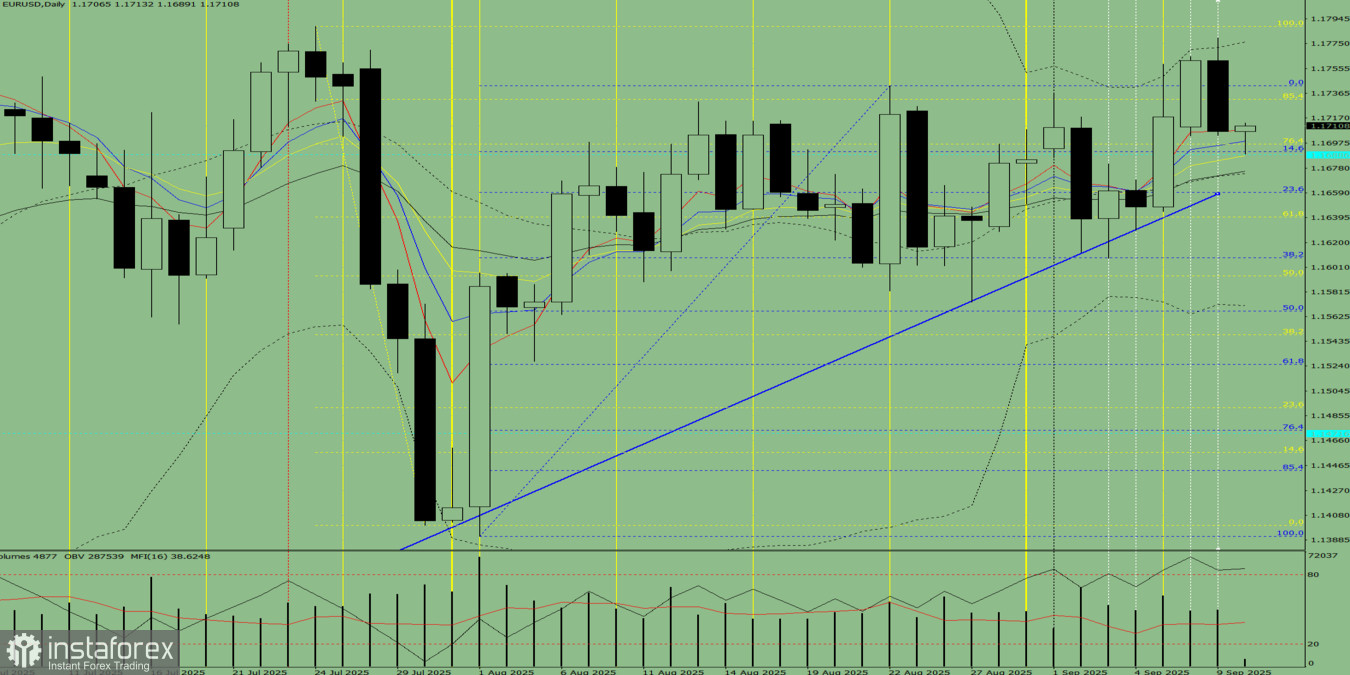
Fig. 1 (daily chart).
Comprehensive Analysis:
- Indicator analysis – upward;
- Fibonacci levels – upward;
- Volumes – upward;
- Candlestick analysis – downward;
- Trend analysis – upward;
- Bollinger Bands – upward;
- Weekly chart – upward.
Overall conclusion: upward trend.
Alternative scenario: from the 1.1707 level (yesterday's daily close), the price may start moving upward toward 1.1742 – upper fractal (blue dotted line). Upon testing this level, the price may pull back downward toward 1.1732 – retracement level of 85.4% (yellow dotted line).


