


Trend Analysis (Fig. 1).
On Wednesday, the market from the 1.3523 level (yesterday's daily close) may begin an upward move toward the target at 1.3593 – upper fractal (yellow dotted line). Upon testing this level, the price may retrace downward toward 1.3565 – upper fractal (daily candle from August 18, 2025).
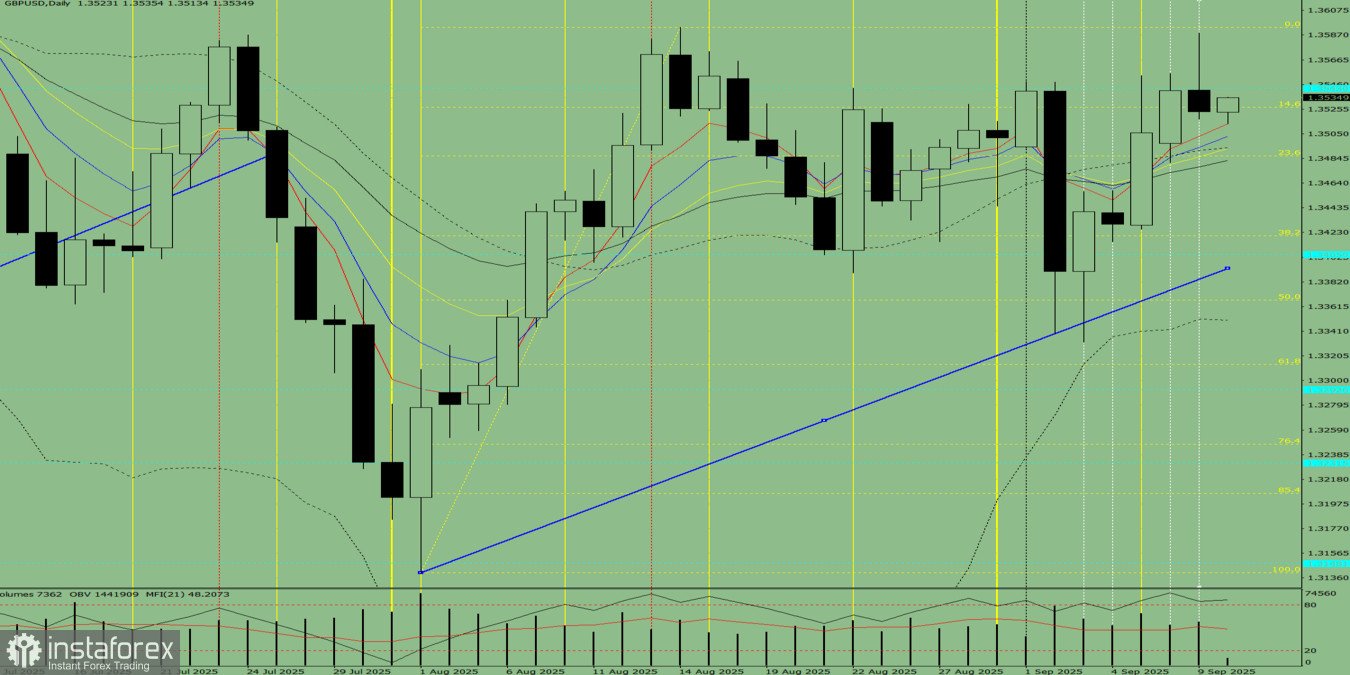
Fig. 1 (daily chart).
Comprehensive Analysis:
- Indicator analysis – upward;
- Fibonacci levels – upward;
- Volumes – upward;
- Candlestick analysis – downward;
- Trend analysis – upward;
- Bollinger Bands – upward;
- Weekly chart – upward.
Overall conclusion: upward trend.
Alternative scenario: on Wednesday, the market from the 1.3523 level (yesterday's daily close) may start moving upward toward 1.3543 – historical resistance level (blue dotted line). Upon testing this level, a pullback downward is possible toward 1.3527 – retracement level of 14.6% (yellow dotted line).


