


EUR/USD 5-Minute Analysis
The EUR/USD currency pair demonstrated quite strong growth on Thursday, which fully matched our expectations. On Thursday, only two events could have triggered volatility: the ECB meeting and the US inflation report. The ECB ultimately left all rates unchanged, as expected. In the final statement, the most noteworthy point was the upward revision of inflation forecasts for 2025-2026. However, this revision was minimal and does not significantly exceed the ECB's target level. Thus, at this time the ECB does not see a threat of uncontrolled price growth.
But it was the US inflation report that caused the dollar to fall, even though it didn't have to. Inflation in the US rose to 2.9%, matching forecasts. Growing inflation usually means the Fed may be slightly less "dovish" through year-end than the market expects. However, we warned traders about two things: First, the dollar had been rising without reason and irrationally on Tuesday and Wednesday. Second, the current inflation figure in the US does not matter for the Fed's September 17 decision. As a result, we saw a generally predictable drop in the US dollar.
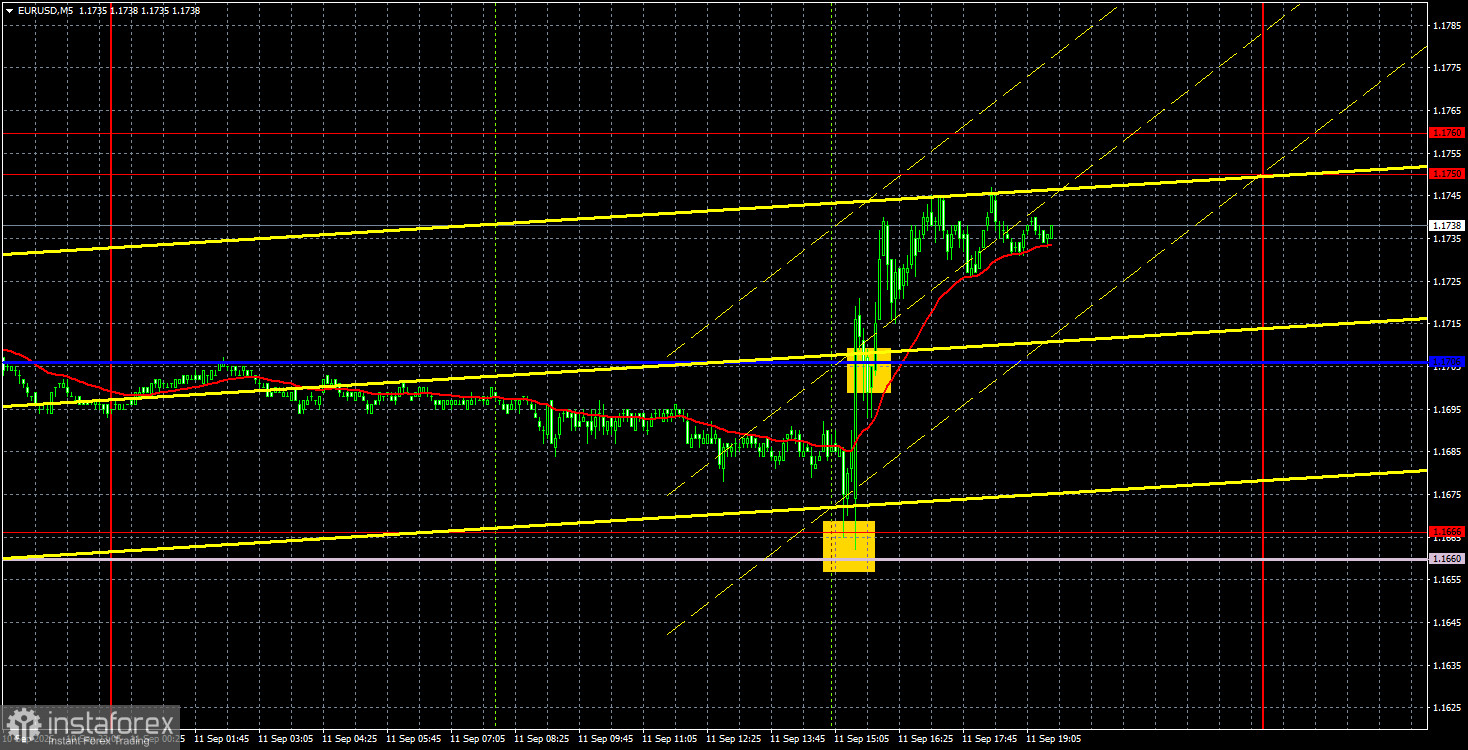
On the 5-minute chart, a great buy signal appeared at the very start of the US session, with a bounce from the 1.1666 level. At the time of the US inflation news, the price had already moved up about 15 pips, so traders could just move their Stop Loss to break even. One had to act quickly, but it was worth it. For the rest of the day, the pair only rose and reached the 1.1750-1.1760 area. Thus, about 60 pips in profit could be earned.
COT Report
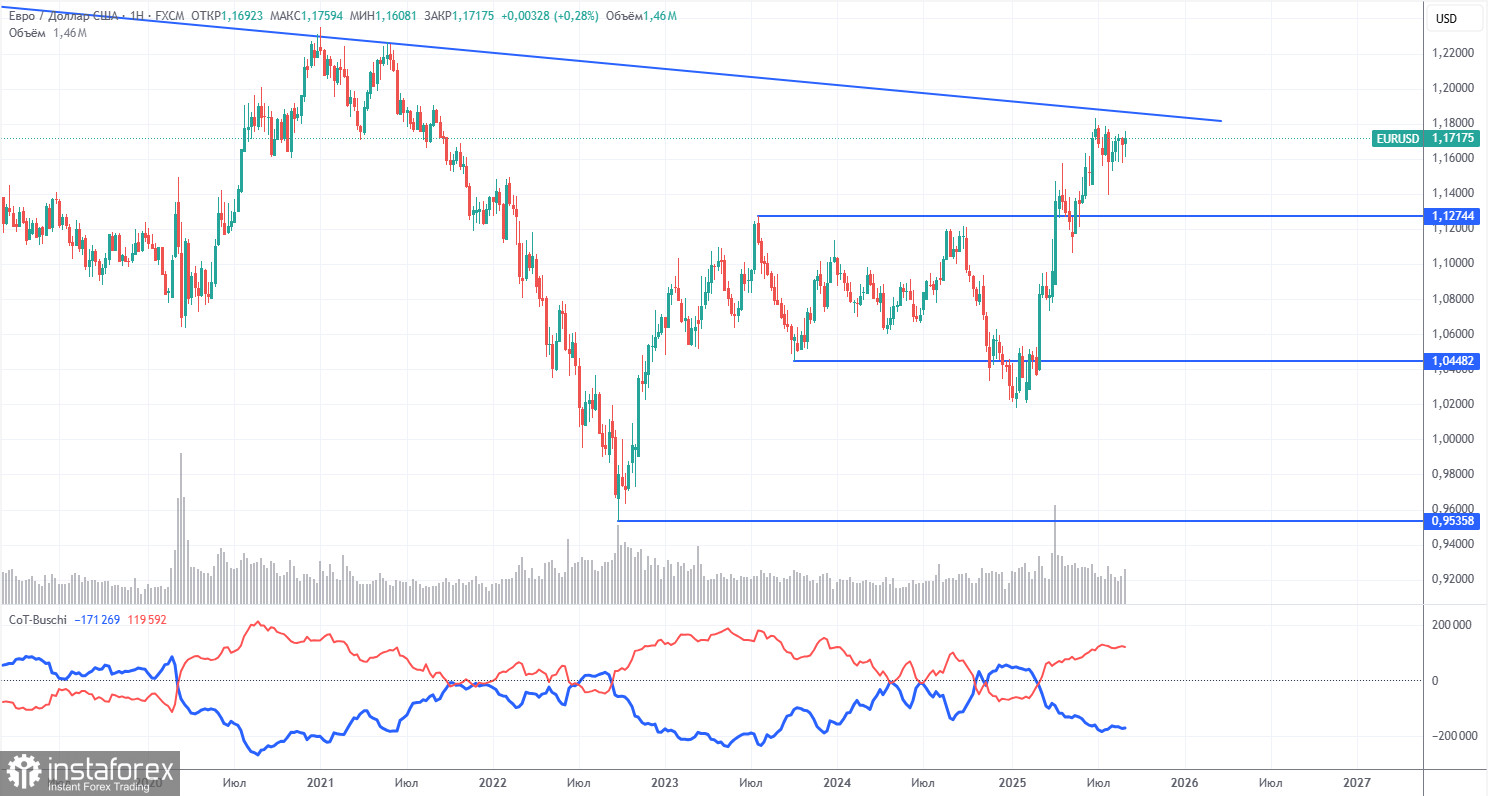
The latest COT report is dated September 2. The chart above clearly shows that the net position of non-commercial traders was bullish for a long time, and bears only tenuously took control at the end of 2024, but quickly lost it. Since Trump became the US president, the dollar has been the only currency to fall. We can't say with 100% certainty that the US dollar's decline will continue, but current world events point precisely in that direction.
We still see no fundamental factors for strengthening the euro, but there remain plenty of reasons for the dollar to decline. The global downtrend remains intact, but does it matter where the price has moved over the last 17 years? Once Trump ends his trade wars, the dollar may go up again, but recent events show that the trade war will continue in one form or another. A potential loss of Fed independence is yet another strong pressure factor on the US currency.
The positioning of the indicator's red and blue lines still shows a bullish tendency. During the last reporting week, long positions from the "Non-commercial" group decreased by 2,700, while shorts increased by 700. The net position for the week thus decreased by 3,400, which is an insignificant change.
EUR/USD 1-Hour Analysis
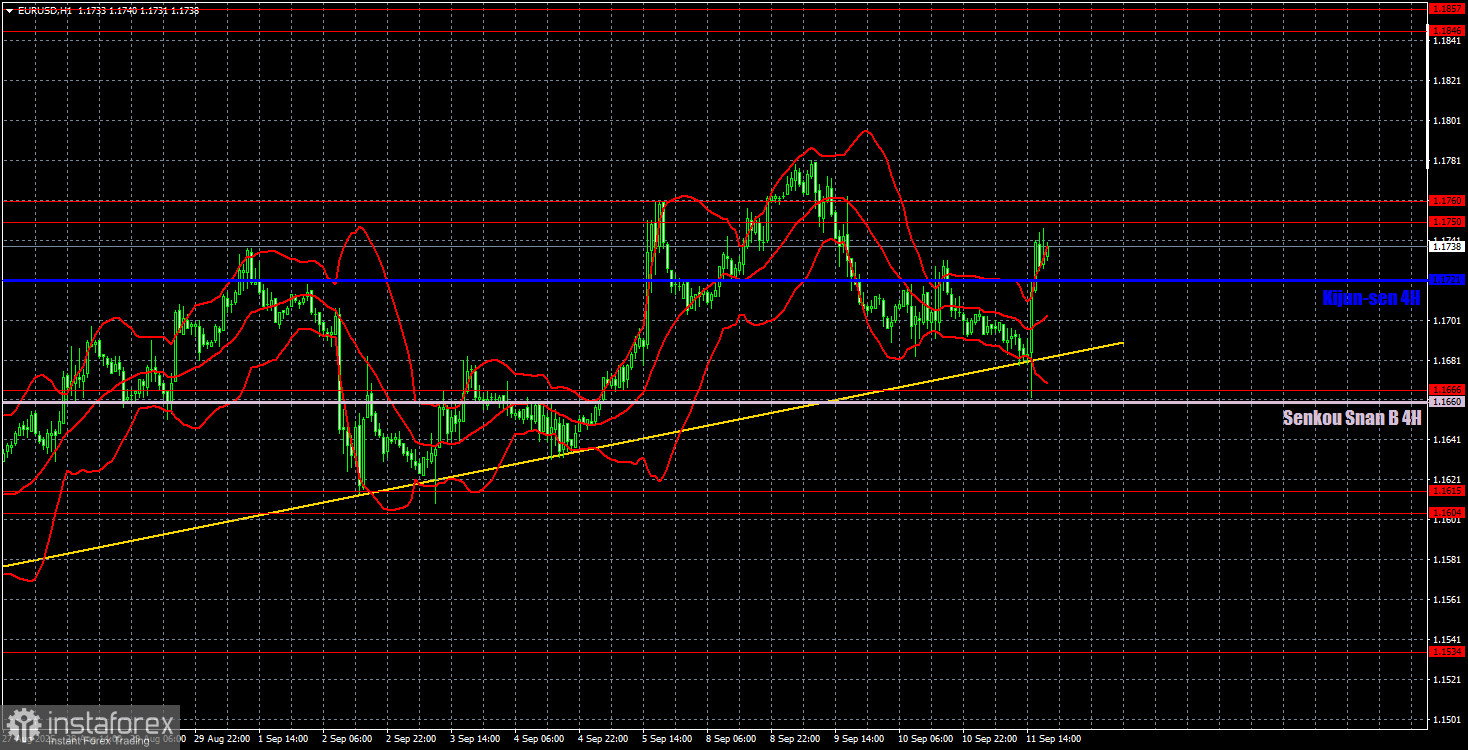
On the hourly timeframe, EUR/USD continues a moderate uptrend. A bounce off the trend line, combined with the US inflation report, sparked a new rise in prices. The pair still spends most of its time in the 1.1615-1.1750 range, but there is an upward skew. The dollar still faces plenty of bearish factors, and even this week, it could have fallen almost every day.
For September 12, we identify the following trading levels: 1.1092, 1.1147, 1.1185, 1.1234, 1.1274, 1.1362, 1.1426, 1.1534, 1.1604-1.1615, 1.1666, 1.1750-1.1760, 1.1846-1.1857, as well as the Senkou Span B line (1.1660) and the Kijun-sen line (1.1721). The Ichimoku indicator lines may move during the day, so keep that in mind for trade signals. Don't forget to set Stop Loss to break even if the price moves in your favor by 15 pips—this will protect you from potential losses if the signal turns out to be false.
On Friday, Germany will publish the second estimate of August inflation, and the US will release the University of Michigan Consumer Sentiment Index for September. Both reports are secondary, but the sentiment index may trigger some market reaction.
Trading Recommendations
On Friday, the pair may continue moving north, but it needs to break through the key 1.1750-1.1760 area. In this case, long positions will be relevant with the target of 1.1846-1.1857. A bounce from this area would trigger a new corrective pullback.
Illustration Explanations:
- Support and resistance price levels – thick red lines where movement may end. They are not trading signal sources.
- Kijun-sen and Senkou Span B lines—These are strong Ichimoku indicator lines transferred to the hourly timeframe from the 4-hour one.
- Extremum levels – thin red lines where the price has previously rebounded. These act as trading signal sources.
- Yellow lines – trend lines, trend channels, and other technical patterns.
- Indicator 1 on the COT charts – the size of the net position for each category of traders.


