


Thursday Trade Review:
1H Chart of GBP/USD
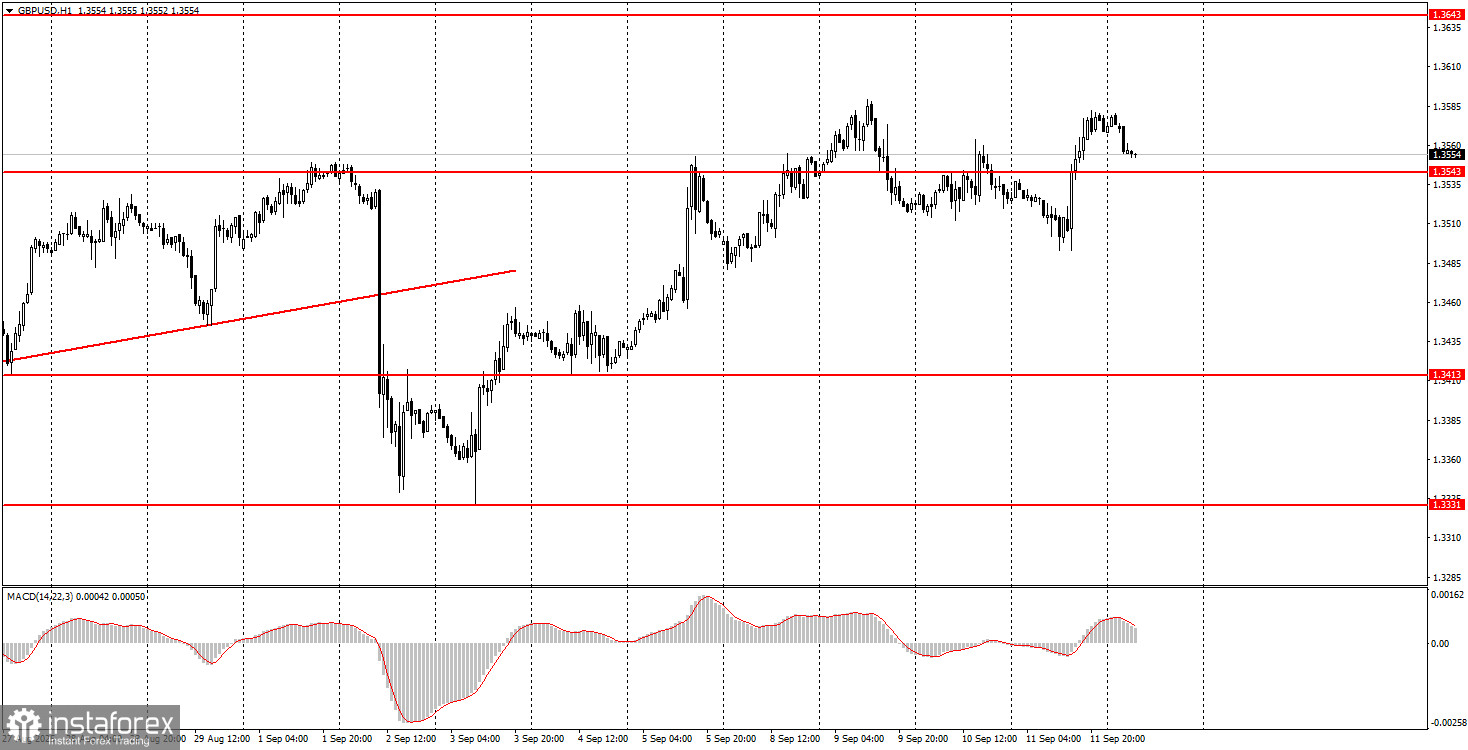
The GBP/USD pair also showed decent growth on Thursday, mainly due to the US inflation report. Many traders are now wondering why the dollar fell again if US inflation rose (which is usually bullish for the dollar). After all, rising inflation means the Fed has less reason to cut the key rate aggressively. That's true, but for the last two weeks it's been clear that the Fed's No. 1 priority is now saving the labor market, which has been weak for four straight months. Thus, two rate cuts by year-end are now practically a done deal. The fact that US inflation is rising—who can be surprised by that during a global trade war the US initiated? The market simply used the inflation report as a trigger for active moves. The dollar has no chances for medium-term growth—whether inflation is high or low, the Fed will be easing monetary policy anyway.
5M Chart of GBP/USD
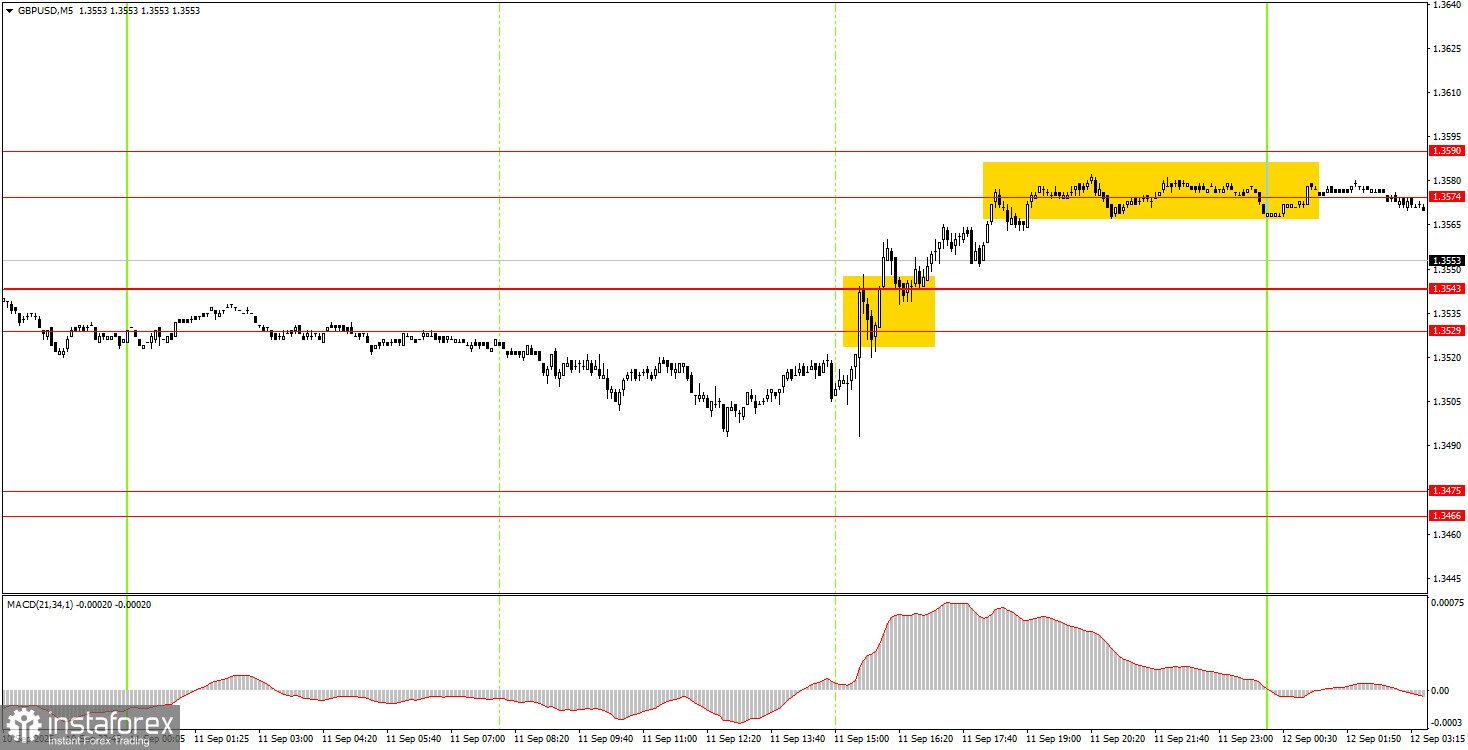
In the 5-minute timeframe, Thursday's movements weren't the best, and the first trading signal came only after the US inflation report. Price broke through the 1.3529–1.3543 area and within an hour reached the target zone of 1.3574–1.3590. Thus, a small profit could be made.
How to Trade on Friday:
On the hourly timeframe, GBP/USD is showing signs of a renewed uptrend, and on higher timeframes, the upward bias remains. As already mentioned, there's no reason to expect medium-term dollar growth, so we expect the pound to keep rising.
On Friday, the GBP/USD pair may well continue moving north. A bounce from the 1.3529–1.3543 area could spark a fresh leg up. A break above the 1.3574–1.3590 zone may also trigger further gains in the pound. Thus, long positions will be relevant today. Consider shorts only if the price consolidates below 1.3529–1.3543.
On the 5-minute timeframe, you can currently trade around the levels: 1.3102–1.3107, 1.3203–1.3211, 1.3259, 1.3329–1.3331, 1.3413–1.3421, 1.3466–1.3475, 1.3529–1.3543, 1.3574–1.3590, 1.3643–1.3652, 1.3682, 1.3763.
For Friday, the UK is scheduled to release July GDP and industrial production data. These reports may only provoke a very weak market reaction. A slightly stronger reaction can be expected from the University of Michigan Consumer Sentiment Index.
Core Trading System Rules:
- Signal Strength: The shorter the time it takes for a signal to form (a rebound or breakout), the stronger the signal.
- False Signals: If two or more trades near a level result in false signals, subsequent signals from that level should be ignored.
- Flat Markets: In flat conditions, pairs may generate many false signals or none at all. It's better to stop trading at the first signs of a flat market.
- Trading Hours: Open trades between the start of the European session and the middle of the US session, then manually close all trades.
- MACD Signals: On the hourly timeframe, trade MACD signals only during periods of good volatility and a clear trend confirmed by trendlines or trend channels.
- Close Levels: If two levels are too close (5–20 pips apart), treat them as a support or resistance zone.
- Stop Loss: Set a Stop Loss to breakeven after the price moves 20 pips in the desired direction.
Key Chart Elements:
Support and Resistance Levels: These are target levels for opening or closing positions and can also serve as points for placing Take Profit orders.
Red Lines: Channels or trendlines indicating the current trend and the preferred direction for trading.
MACD Indicator (14,22,3): A histogram and signal line used as a supplementary source of trading signals.
Important Events and Reports: Found in the economic calendar, these can heavily influence price movements. Exercise caution or exit the market during their release to avoid sharp reversals.
Forex trading beginners should remember that not every trade will be profitable. Developing a clear strategy and practicing proper money management are essential for long-term trading success.


