


Trend analysis (Fig. 1).
On Monday, from the level of 1.1734 (the closing of Friday's daily candle), the market may continue upward toward 1.1788 – the upper fractal (yellow dashed line). Upon reaching this level, a downward move toward 1.1747 – the upper fractal (daily candle of September 12, 2025) – is possible.
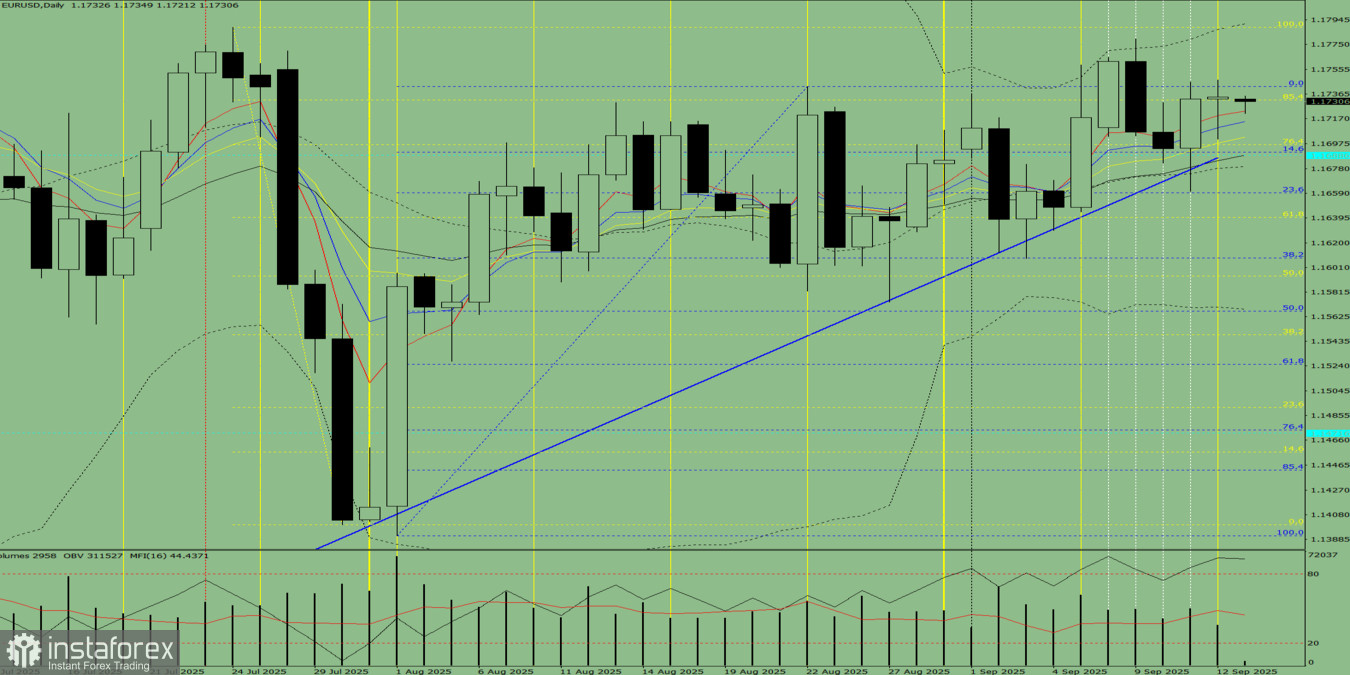
Fig. 1 (daily chart).
Comprehensive analysis:
- Indicator analysis – upward;
- Fibonacci levels – upward;
- Volumes – upward;
- Candlestick analysis – upward;
- Trend analysis – upward;
- Bollinger Bands – upward;
- Weekly chart – upward.
Overall conclusion: upward trend.
Alternative scenario: from the level of 1.1734 (the closing of Friday's daily candle), the price may continue upward toward 1.1747 – the upper fractal (daily candle of September 12, 2025). Upon reaching this level, a pullback downward toward 1.1697 – the 76.4% retracement level (yellow dashed line) – is possible.


