


Trend Analysis (Fig. 1).
On Wednesday, from the level of 1.3642 (yesterday's daily close), the market may begin moving downward toward 1.3626 — a historical support level (blue dashed line). Upon testing this level, the price may continue moving upward toward 1.3682 — the 161.8% target level (red dashed line).
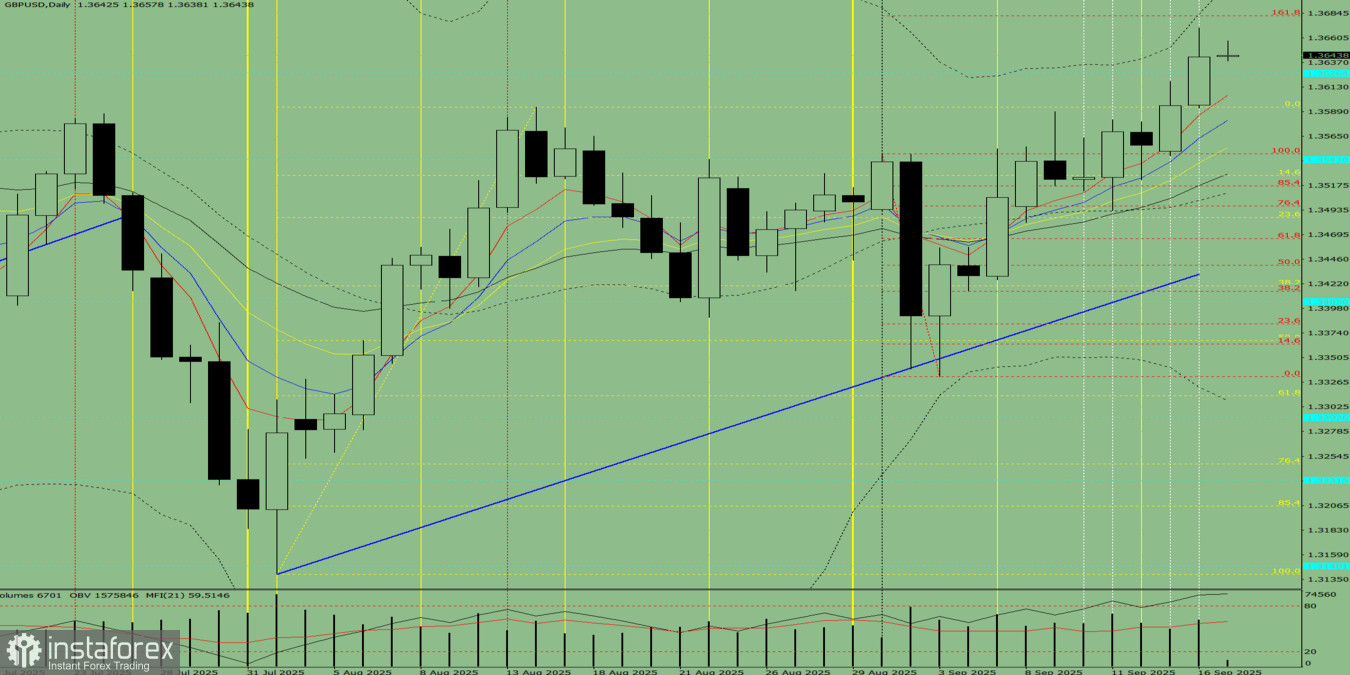
Fig. 1 (daily chart).
Comprehensive Analysis:
- Indicator analysis – upward;
- Fibonacci levels – upward;
- Volumes – upward;
- Candlestick analysis – downward;
- Trend analysis – upward;
- Bollinger Bands – upward;
- Weekly chart – upward.
General conclusion: upward trend.
Alternative scenario: On Wednesday, from the level of 1.3642 (yesterday's daily close), the market may continue moving upward toward 1.3682 — the 161.8% target level (red dashed line). Upon testing this level, a pullback downward toward 1.3624 — a historical support level (blue dashed line) is possible.


