


Trend Analysis (Fig. 1).
On Tuesday, from the level of 1.3510 (yesterday's daily close), the market may start moving downward with a target of 1.3465 – the 61.8% retracement level (blue dotted line). Upon testing this level, the price may then move upward toward 1.3482 – the 61.8% retracement level (red dotted line).
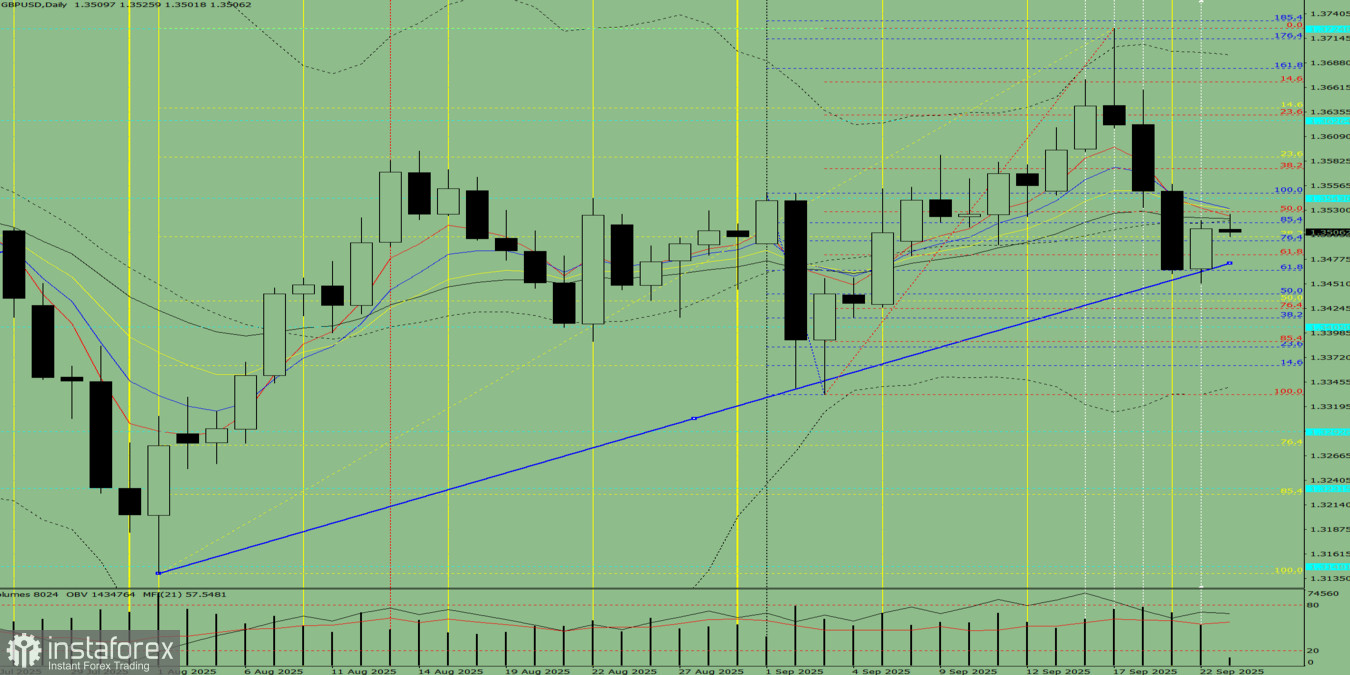
Fig. 1 (daily chart).
Comprehensive Analysis:
- Indicator analysis – down;
- Volumes – down;
- Candlestick analysis – down;
- Trend analysis – down;
- Bollinger Bands – down;
- Weekly chart – down.
Overall conclusion: downward trend.
Alternative scenario: from the level of 1.3510 (yesterday's daily close), the price may start moving downward with a target of 1.3440 – the 50% retracement level (blue dotted line). Upon testing this level, the price may then move upward toward 1.3465 – the 61.8% retracement level (blue dotted line).


