


Tuesday's trade analysis: EUR/USD 1H chart
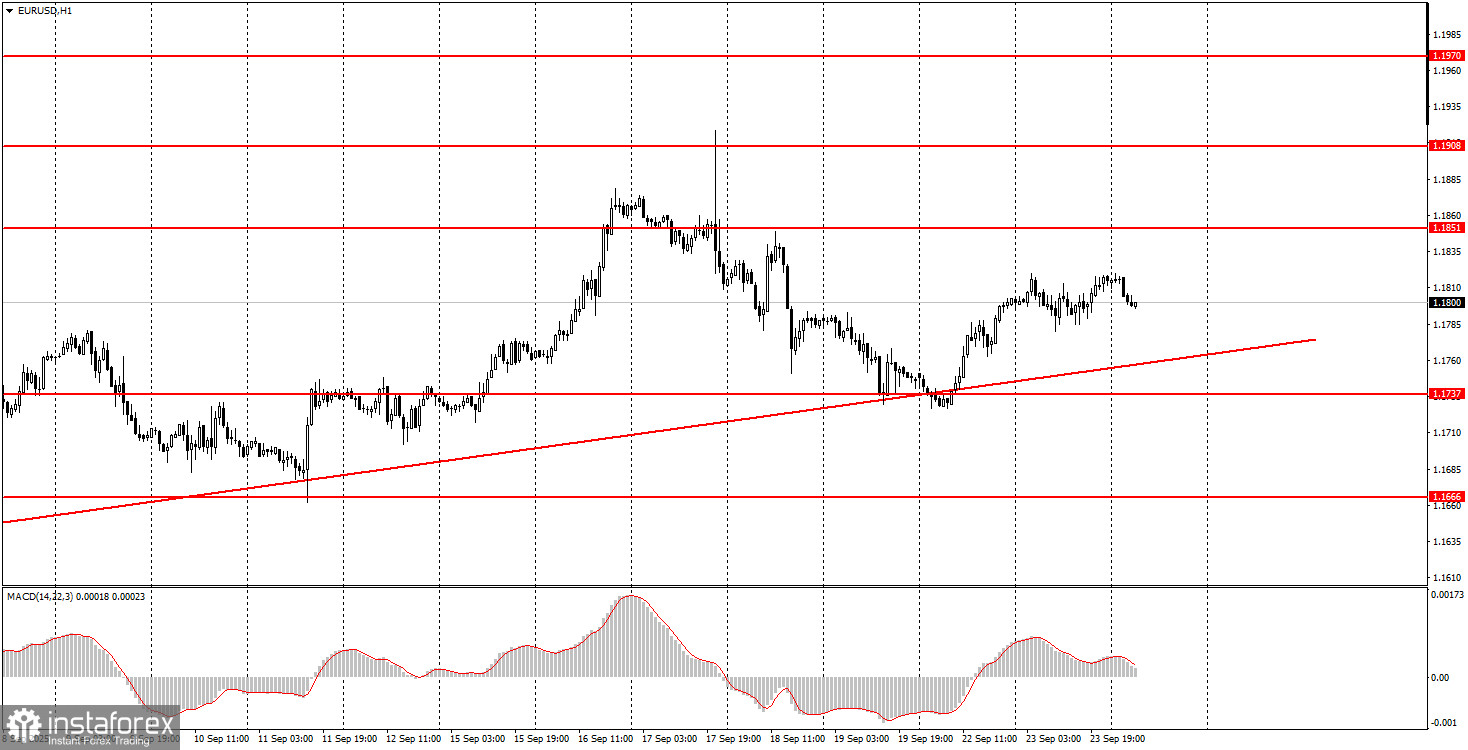
On Tuesday, the EUR/USD currency pair hardly traded at all. At least six reports (all business activity indices) were published during the day, along with Jerome Powell's speech. As we can see, the market did not react to these events at all. Thus, we can immediately assume that all macroeconomic statistics turned out to be bland, and Mr. Powell said nothing new to the markets. In principle, this was indeed the case. European business activity indices showed a mixed dynamic, without demonstrating overall strengthening or weakening. The American indices were of no interest to the market at all, since the U.S. publishes the more important ISM business activity indicators. In his evening speech, Powell spoke about the importance of fulfilling both of the Fed's mandates, not just maintaining high employment. The Fed Chair noted upside risks for inflation and downside risks for the labor market. Thus, the U.S. dollar did not receive support from fundamentals or macroeconomics, and the upward trend on the hourly timeframe remains intact.
EUR/USD 5M chart
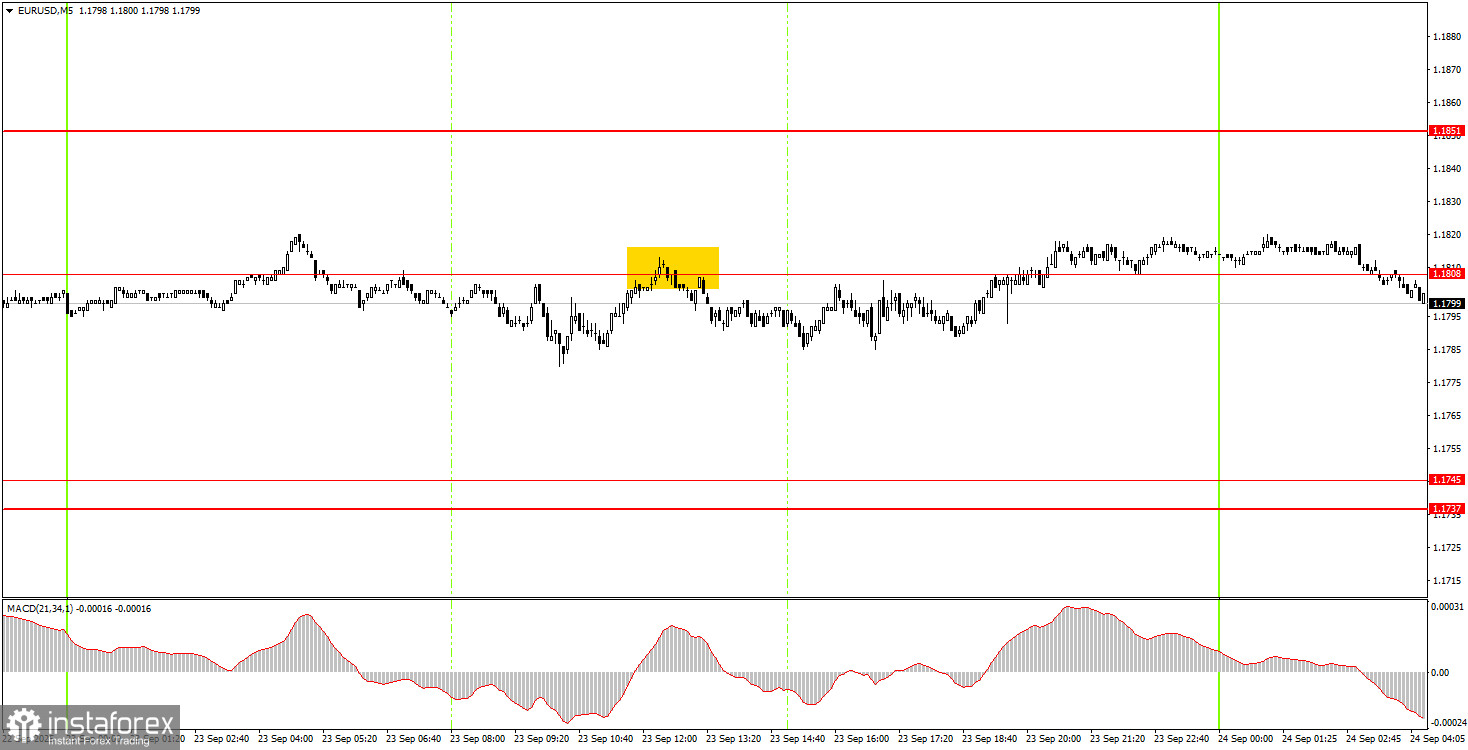
On the 5-minute timeframe, several sell signals were formed on Tuesday, but they all duplicated each other and did not lead to any significant decline. Therefore, beginners had grounds for opening short positions, but it was extremely difficult to earn anything on Tuesday.
How to trade on Wednesday On the hourly timeframe, the EUR/USD pair has excellent growth prospects, and the short-term trend remains upward. The fundamental and macroeconomic background continues to be negative for the U.S. dollar, so we still do not expect strong strengthening of the American currency. From our point of view, as before, the U.S. dollar can only count on technical corrections, one of which we saw on Thursday and Friday. The Fed meeting did not change the outlook for the dollar in any way.
On Wednesday, the EUR/USD pair may continue moving north, as the upward trend remains intact, which is confirmed by the trendline. Only after breaking below this line will we expect stronger strengthening of the dollar, although there are no fundamental reasons for that.
On the 5-minute timeframe, the following levels should be considered: 1.1354–1.1363, 1.1413, 1.1455–1.1474, 1.1527, 1.1571–1.1584, 1.1655–1.1666, 1.1737–1.1745, 1.1808, 1.1851, 1.1908, 1.1970–1.1988. On Wednesday, no important publications or events are scheduled in either the U.S. or the EU. And Tuesday showed that even their presence does not guarantee market movement. Thus, another "flat day" is very likely today.
Basic rules of the trading system:
- The strength of a signal is determined by the time it took to form (bounce or breakout of a level). The less time it takes, the stronger the signal.
- If two or more trades were opened from false signals near a certain level, then all subsequent signals from that level should be ignored.
- In flat conditions, any pair can generate many false signals or none at all. In any case, at the first signs of a flat, it is better to stop trading.
- Trades are opened during the period from the start of the European session until the middle of the U.S. session, after which all trades should be closed manually.
- On the hourly timeframe, it is preferable to trade signals from the MACD indicator only when there is good volatility and a trend confirmed by a trendline or channel.
- If two levels are too close to each other (5 to 20 points), they should be treated as a support or resistance zone.
- When the price has moved 15 points in the right direction, set Stop Loss to breakeven.
What's on the charts:
- Support and resistance price levels – target levels for opening buy or sell positions. Take Profit levels can be placed near them.
- Red lines – channels or trendlines that show the current trend and the preferred trading direction.
- MACD indicator (14, 22, 3) – histogram and signal line – an auxiliary indicator that can also be used as a source of signals.
- Important speeches and reports (always in the economic calendar) can strongly affect the currency pair's movement. During their release, trading should be done with maximum caution, or traders should exit the market to avoid sharp reversals against the preceding trend.
Beginner forex traders should remember that not every trade can be profitable. Developing a clear strategy and practicing money management are the keys to long-term success in trading.


