


Trend analysis (Fig. 1)
On Wednesday, from the 1.1814 level (yesterday's daily close), the market may start moving downward, targeting 1.1751 – the 76.4% retracement level (red dotted line). Upon testing this level, the price may rebound upward, targeting 1.1762 – the 85.4% retracement level (red dotted line).
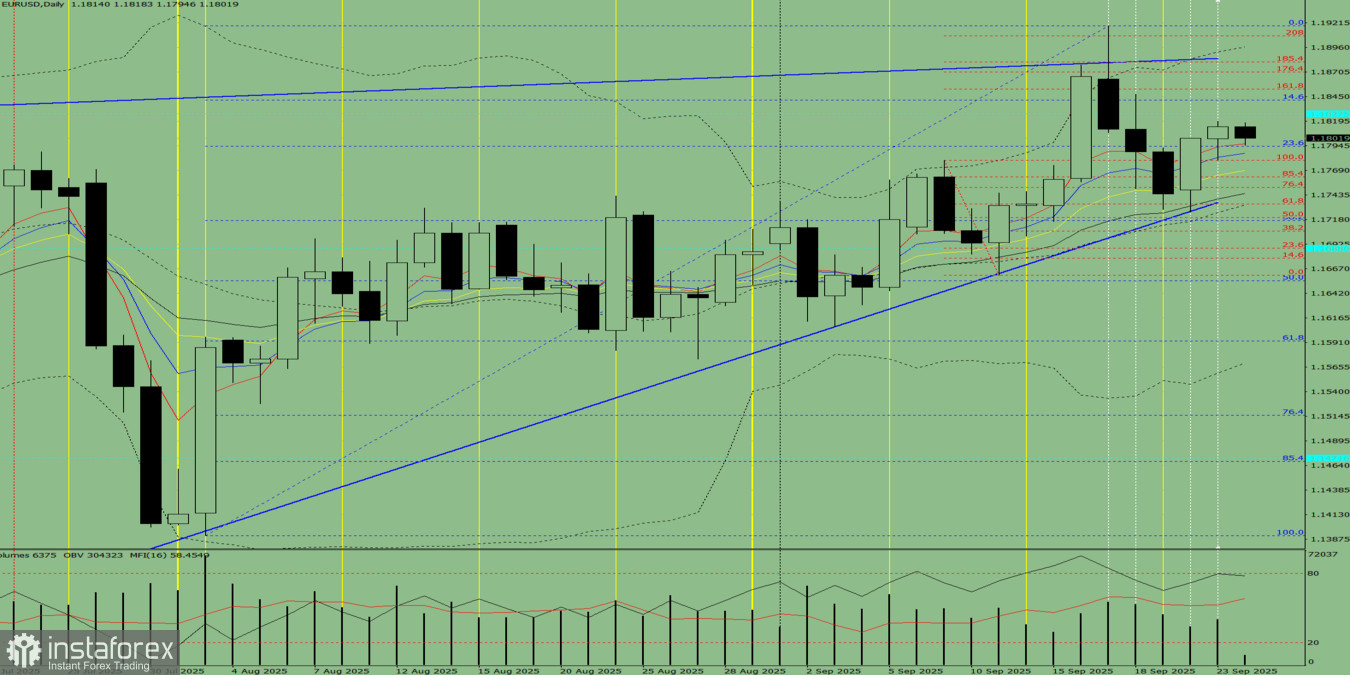
Fig. 1 (daily chart).
Comprehensive analysis:
- Indicator analysis – downward;
- Fibonacci levels – downward;
- Volumes – downward;
- Candlestick analysis – downward;
- Trend analysis – downward;
- Bollinger Bands – downward;
- Weekly chart – downward.
Overall conclusion: downward trend.
Alternative scenario: From the 1.1814 level (yesterday's daily close), the price may begin to move downward, targeting 1.1734 – the 61.8% retracement level (red dotted line). Upon testing this level, the price may rebound upward, targeting 1.1751 – the 76.4% retracement level (red dotted line).


