


On Wednesday, the EUR/USD currency pair unexpectedly resumed its downward movement, for which there is simply no clear explanation. As always, it's easy to come up with a post-hoc reason: someone can say Powell was not "dovish" enough, or blame a spike in risk-off sentiment. But these are just excuses, not analysis. With that logic, you can explain anything.
Our approach to analysis is as follows: if an event can be forecast with high probability, we do so. If price moves in the opposite direction, we call it what it is—an illogical move. It's essential to remember that not everything in the FX market is driven by macroeconomic or fundamental factors. The FX market, first and foremost, is a marketplace where buyers and sellers come together. Trading occurs not just when Jerome Powell, Donald Trump, or other top figures in the world economy speak. The same goes for macroeconomic releases: the market doesn't only move on inflation data or NonFarm Payrolls.
What does this mean? At any moment, a major bank can execute a large trade and trigger a move in price—even if the fundamental, macro, or technical backdrop doesn't support it. Sometimes, we see movement that contradicts prior events—an illogical move.
That's precisely what we're seeing now. On Tuesday evening, Powell delivered another speech. In short, his rhetoric is unchanged. Last week, after the FOMC meeting, he suggested the key rate could be cut twice more before year-end—but he never announced such a plan. In other words, everything depends on macro data, not the whims of any FOMC officials or the demands of Donald Trump. Powell keeps underscoring this: everything will come down to macroeconomic data.
Put another way, two more cuts by year-end is just one possible scenario, not a set plan. As we often say, the Fed will not rush into monetary easing because there is no need to do so. US inflation is climbing, and this has been the top focus for Fed officials in recent years. Yes, the US labor market is currently soft, but who's to blame—and why should the Fed have to solve that problem?
The answer is clear: Donald Trump's policies. Specifically, his immigration policy blocks migrant workers and expels those already in the US. His trade policies also hinder economic growth, resulting in weaker production and business activity. Therefore, Trump himself should take responsibility for these outcomes, rather than blaming the Fed and Jerome Powell.
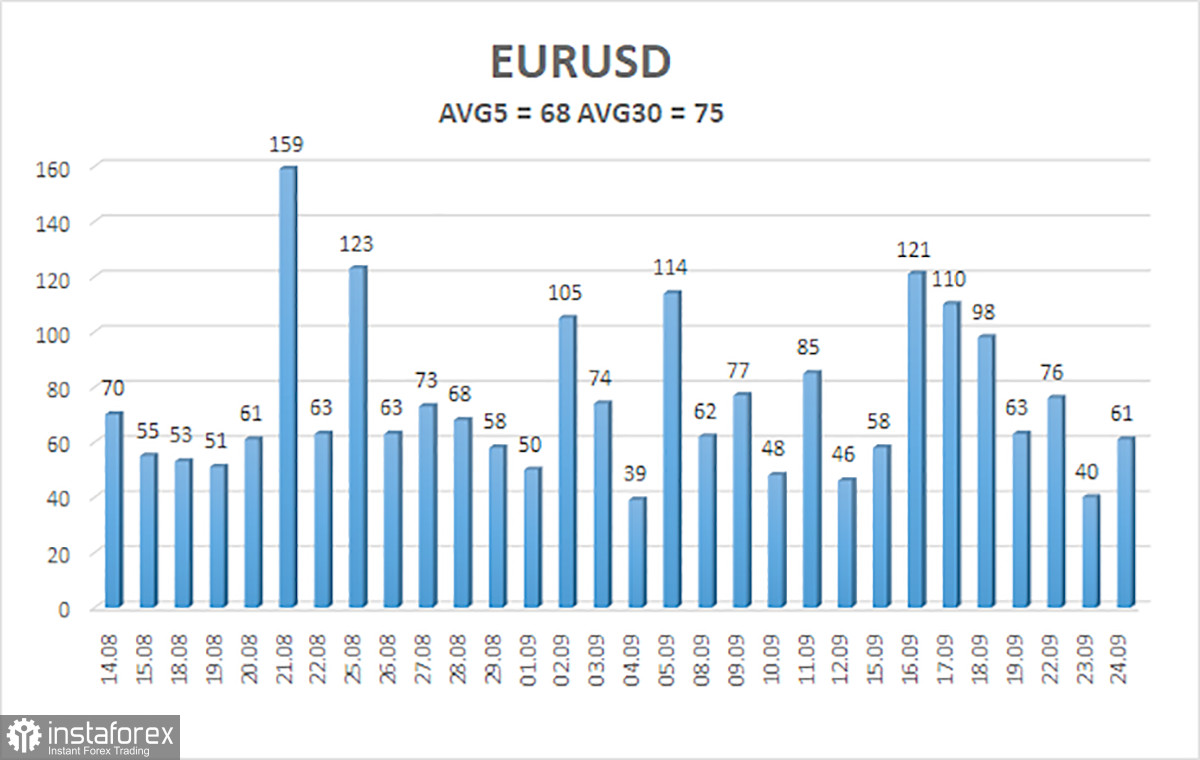
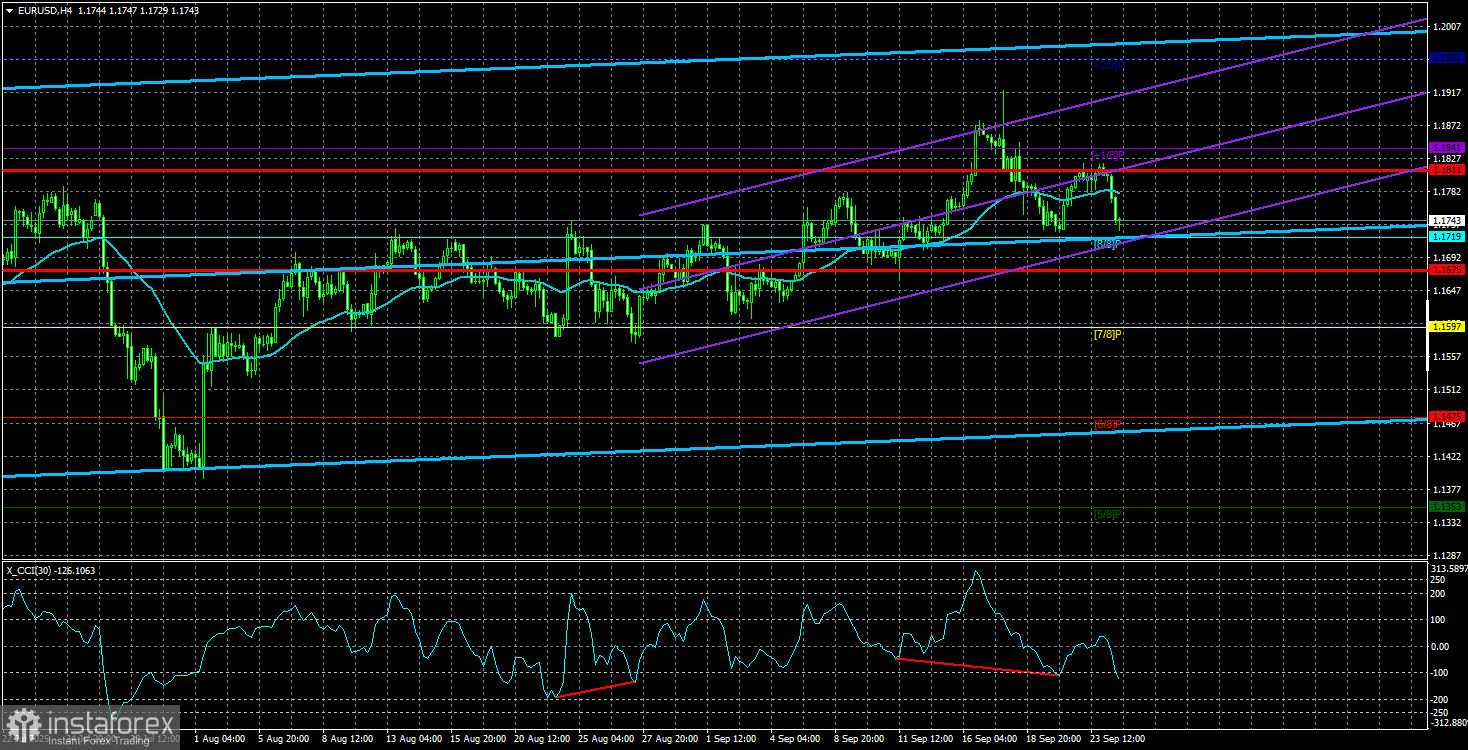
The average volatility for EUR/USD over the last five trading days as of September 25 is 68 pips, which is considered "average." We expect the pair to move between 1.1655 and 1.1834 on Thursday. The higher linear regression channel remains pointed upward, indicating an upward trend. The CCI indicator entered overbought territory last week, which likely triggered the current downward correction. At present, a new bullish divergence has formed.
Nearest Support Levels:
S1 – 1.1719
S2 – 1.1597
S3 – 1.1475
Nearest Resistance Levels:
R1 – 1.1841
R2 – 1.1963
Trading Recommendations:
The EUR/USD pair has initiated a new correction, but the overall uptrend remains intact—visible at every time frame. Trump's policies still dominate US dollar dynamics, and he has no intention of "resting on his laurels." The dollar rallied for a whole month, but now it appears to be time for a new phase of extended weakness. If the price is below the moving average, you can consider small shorts with targets at 1.1655 and 1.1597 purely on a technical basis. If the price is above the moving average, long positions toward 1.1841 and 1.1963 remain relevant in the direction of the trend.
Chart Elements Explained:
- Linear regression channels help determine the current trend. If both channels point in the same direction, the trend is strong.
- The moving average line (settings 20,0, smoothed) indicates the short-term trend and trade direction.
- Murray levels serve as target levels for moves and corrections.
- Volatility levels (red lines) are the likely price channel for the next day, based on current volatility readings.
- The CCI indicator: dips below -250 (oversold) or rises above +250 (overbought) mean a trend reversal may be near.


