


Trend analysis (Fig. 1).
On Thursday, from the 1.1737 level (yesterday's daily close), the market may continue moving downward toward 1.1706 – the 38.2% retracement level (red dotted line). When testing this level, the price may rebound upward toward 1.1720 – the 50% retracement level (red dotted line).
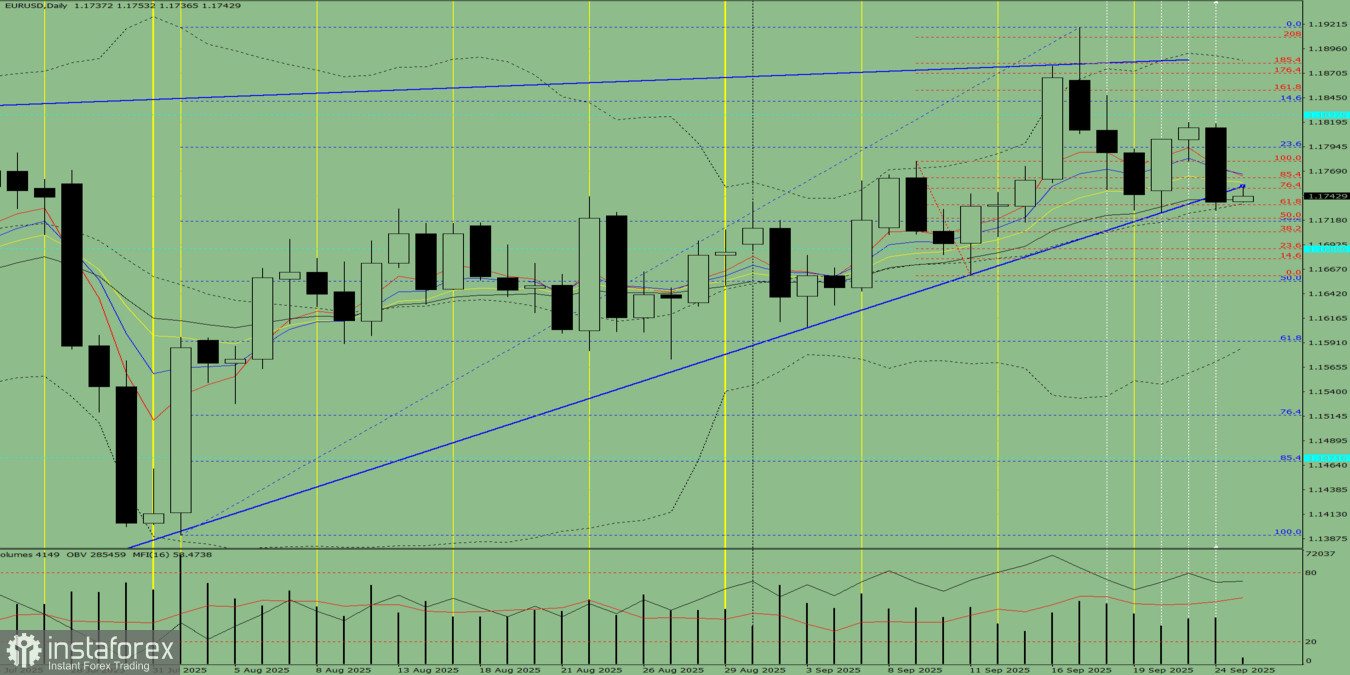
Fig. 1 (daily chart).
Comprehensive analysis:
- Indicator analysis – downward;
- Fibonacci levels – downward;
- Volumes – downward;
- Candlestick analysis – downward;
- Trend analysis – downward;
- Bollinger Bands – downward;
- Weekly chart – downward.
Overall conclusion: downward trend.
Alternative scenario: On Thursday, from the 1.1737 level (yesterday's daily close), the market may continue moving downward toward 1.1688 – the 23.6% retracement level (red dotted line). When testing this level, the price may rebound upward toward 1.1706 – the 38.2% retracement level (red dotted line).


