


Trend analysis (Fig. 1).
On Monday, the market from the level of 1.3400 (Friday's daily candle close) may continue upward with the target at 1.3454 – the 8-period EMA (thin blue line). Upon reaching this line, a corrective move downward is possible with the target at 1.3363 – the 61.8% pullback level (yellow dotted line). When testing this level, the price may then start moving upward with the target at 1.3381 – the 14.6% pullback level (blue dotted line).
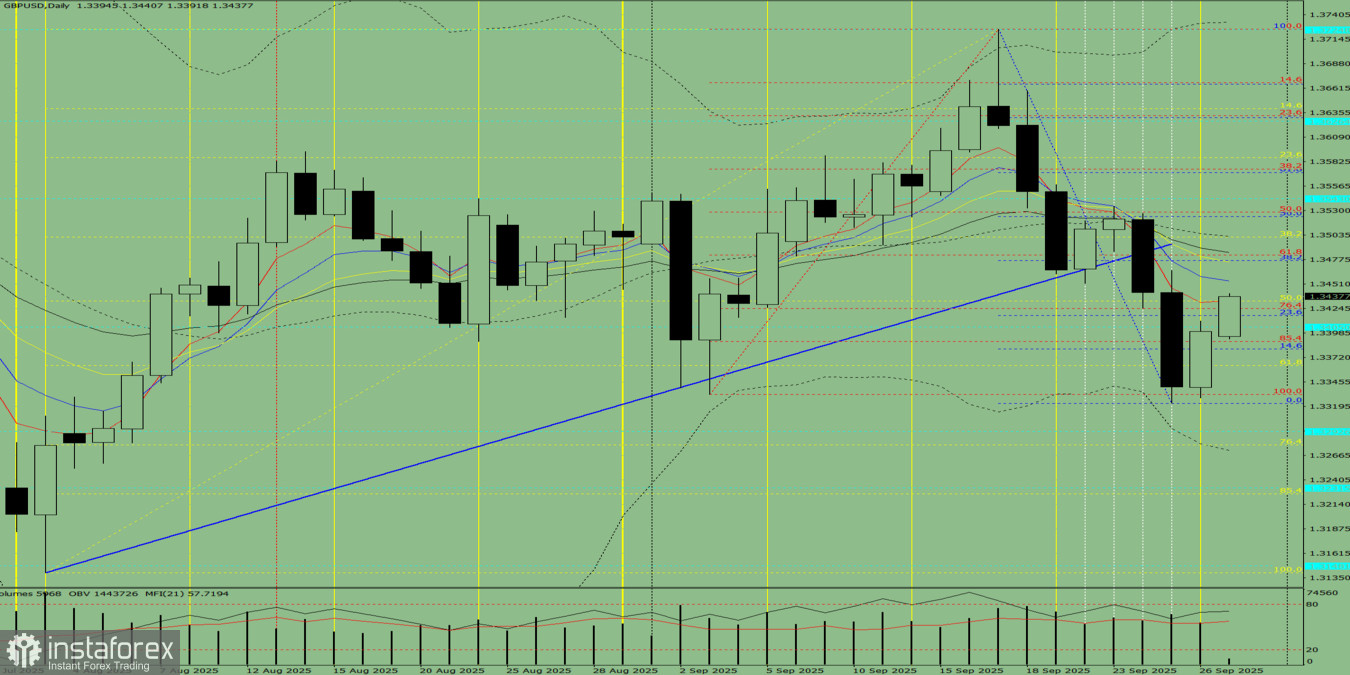
Fig. 1 (daily chart).
Comprehensive analysis:
- Indicator analysis – up;
- Fibonacci levels – up;
- Volumes – up;
- Candlestick analysis – up;
- Trend analysis – up;
- Bollinger Bands – up;
- Weekly chart – up.
General conclusion: upward trend.
Alternative scenario: from the level of 1.3400 (Friday's daily candle close), the price may continue moving upward with the target at 1.3454 – the 8-period EMA (thin blue line). Upon reaching this line, a corrective move downward is possible with the target at 1.3381 – the 14.6% pullback level (blue dotted line). When testing this level, a corrective upward move is possible with the target at 1.3406 – the historical resistance level (light blue dotted line).


