


Trend analysis (Fig. 1).
This week, the market from the level of 1.1699 (close of the last weekly candle) may start moving downward with the target at 1.1536 – the 38.2% pullback level (blue dotted line). When testing this level, the price may retrace upward with the target at 1.1572 – the upper fractal (red dotted line).
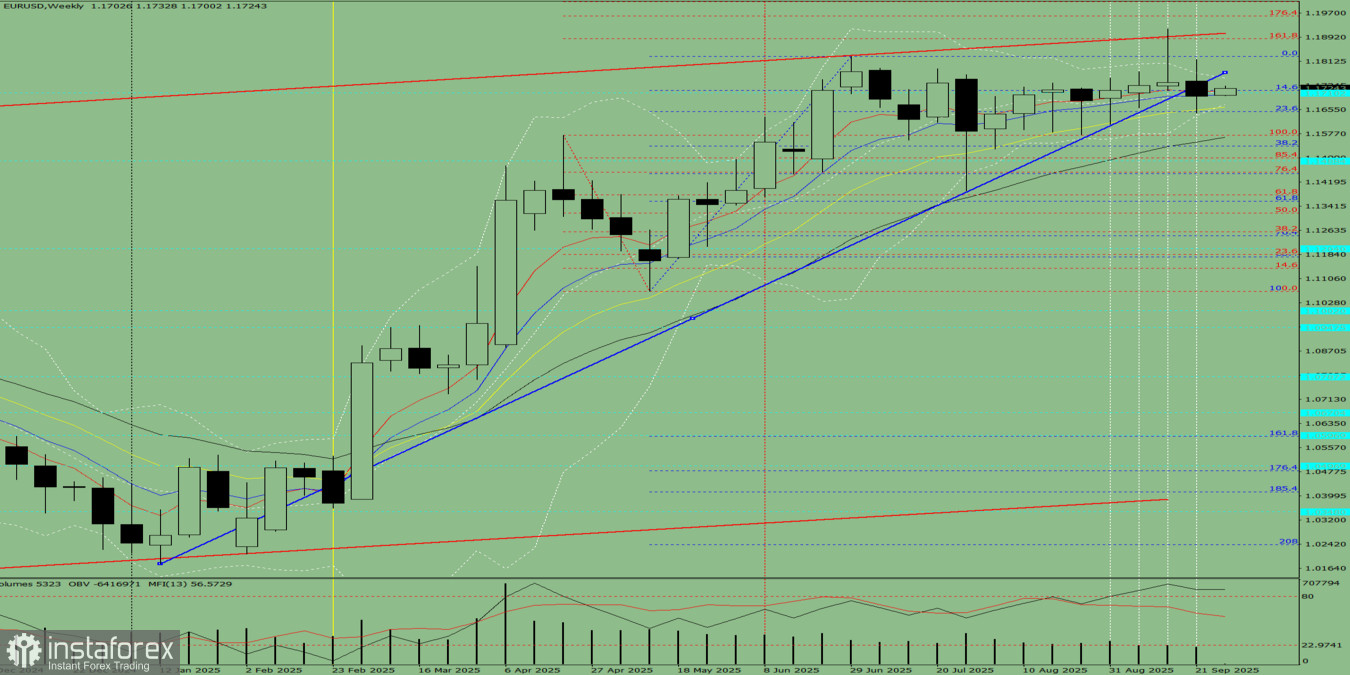
Fig. 1 (weekly chart).
Comprehensive analysis:
- Indicator analysis – down;
- Fibonacci levels – down;
- Volumes – down;
- Candlestick analysis – down;
- Trend analysis – down;
- Bollinger Bands – down;
- Monthly chart – down.
Conclusion of the comprehensive analysis: downward movement.
Overall outcome of the weekly candle calculation for EUR/USD: during the week, the price will most likely show a downward trend, with the first upper shadow on the weekly black candle (Monday – upward) and the second lower shadow (Friday – upward).
Alternative scenario: the pair from the level of 1.1699 (close of the last weekly candle) may start moving downward with the target at 1.1488 – the historical resistance level (light blue dotted line). When testing this level, the price may then start moving upward with the target at 1.1536 – the 38.2% pullback level (blue dotted line).


