


EUR/USD 5-Minute Analysis
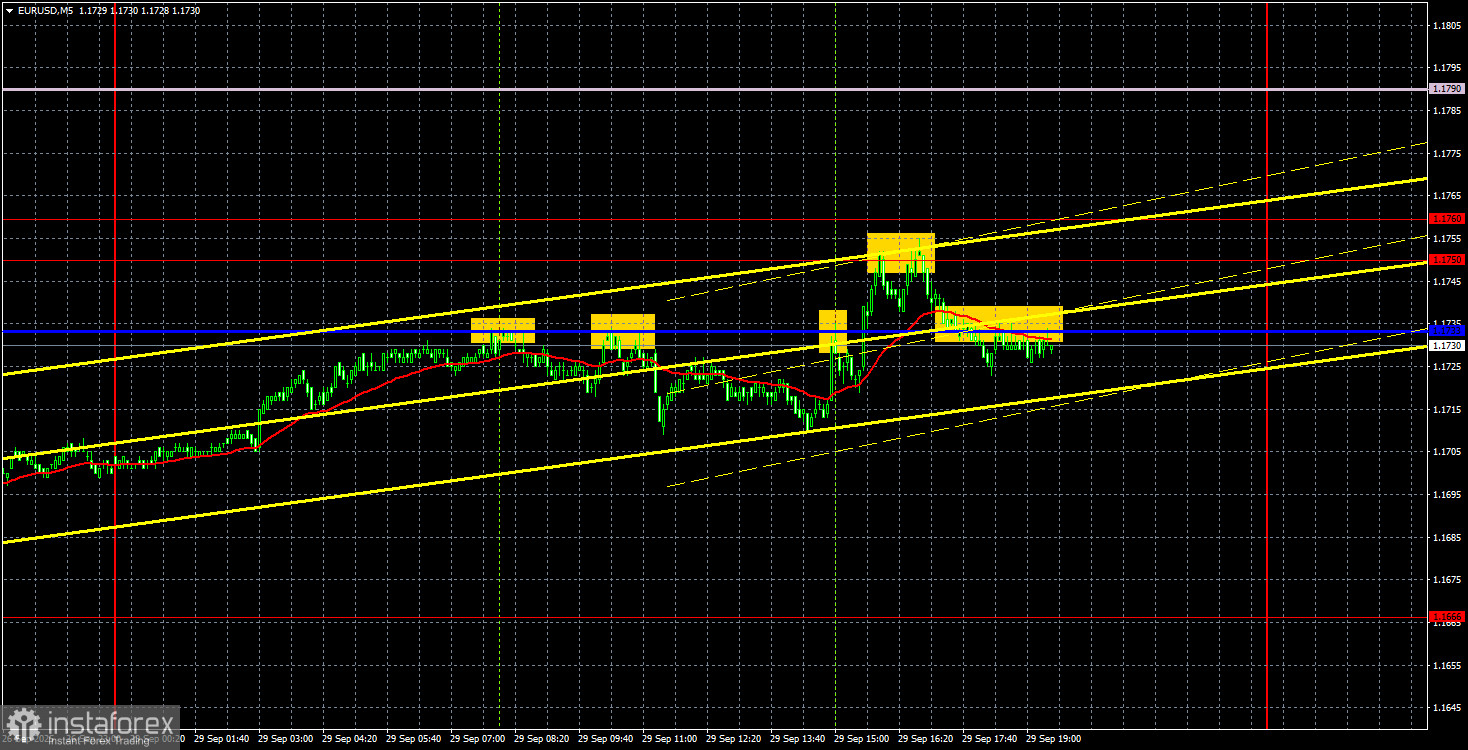
On Monday, the EUR/USD currency pair moved upward and managed to break through the descending trendline. Further growth of the pair was capped by the 1.1750–1.1760 area, which has repeatedly acted as support or resistance for the price. Thus, at this point, it is still too early to be fully confident that the short-term downtrend has ended.
Nevertheless, we have repeatedly noted that there have been no strong reasons for medium-term dollar growth. Over just the past few days, news has created a new fundamental basis for a decline in the U.S. currency. Donald Trump introduced new tariffs and announced plans to tax even the film industry. Expectations of further Federal Reserve policy easing by year-end have risen. Mass arrests of illegal migrants have begun in Chicago. Clearly, there are numerous reasons for the market to start selling off the U.S. dollar once again. On the daily TF, the uptrend never ended. On Monday, there were no important macroeconomic releases in either the U.S. or the EU, which explains the pair's low volatility. Nevertheless, the euro rose throughout the day.
On the 5-minute TF, a relatively large number of trading signals were generated; however, due to weak volatility, the price spent most of the day within a narrow range, encompassing two levels and one line. The price repeatedly bounced off these levels during the day: three times from the Kijun-sen and twice from the 1.1750–1.1760 area. In none of the cases did the price move more than 20–30 pips in the right direction. However, the problem was not the signals but the weak volatility of a "dull Monday."
COT Report
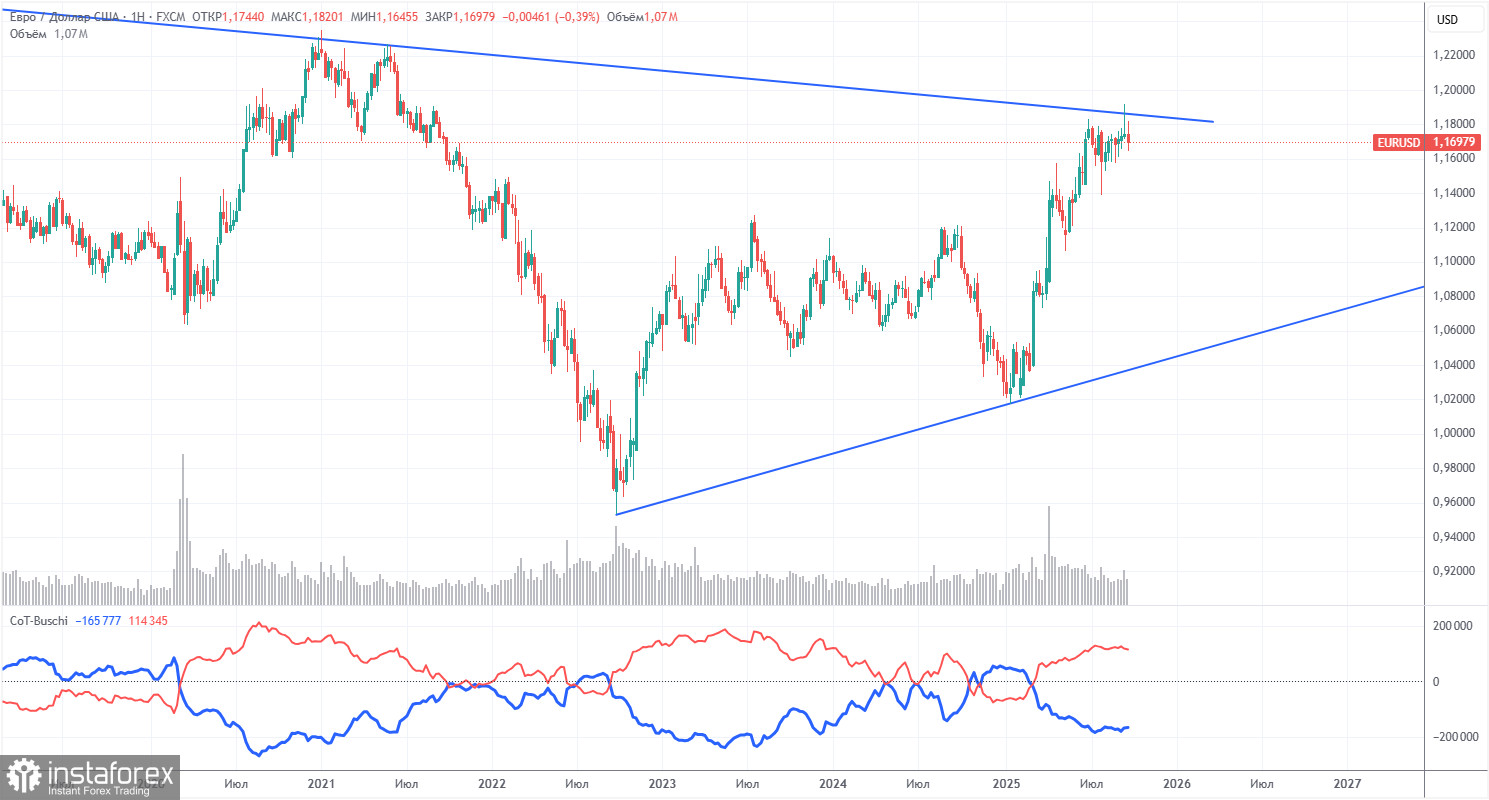
The latest COT report is dated September 23. As the chart above clearly shows, the net position of non-commercial traders has long been "bullish." Bears barely managed to gain control at the end of 2024 but quickly lost it. Since Trump took office for his second term as president, the dollar has been falling. We cannot say with 100% certainty that this decline will continue, but current global developments suggest otherwise.
We still see no fundamental reasons for the euro to weaken, while there remain plenty of reasons for the dollar to fall. The global downtrend remains in place, but what does it matter now where the price moved over the past 17 years? Once Trump ends his trade wars, the dollar may recover, but recent events suggest that the war will continue in one form or another. The potential loss of Federal Reserve independence is another powerful factor weighing on the U.S. currency.
The positions of the red and blue lines of the indicator continue to indicate a bullish trend. Over the last reporting week, the number of longs among the "Non-commercial" group decreased by 800, while the number of shorts increased by 2,600. Accordingly, the net position decreased by 3,400 contracts for the week.
EUR/USD 1-Hour Analysis
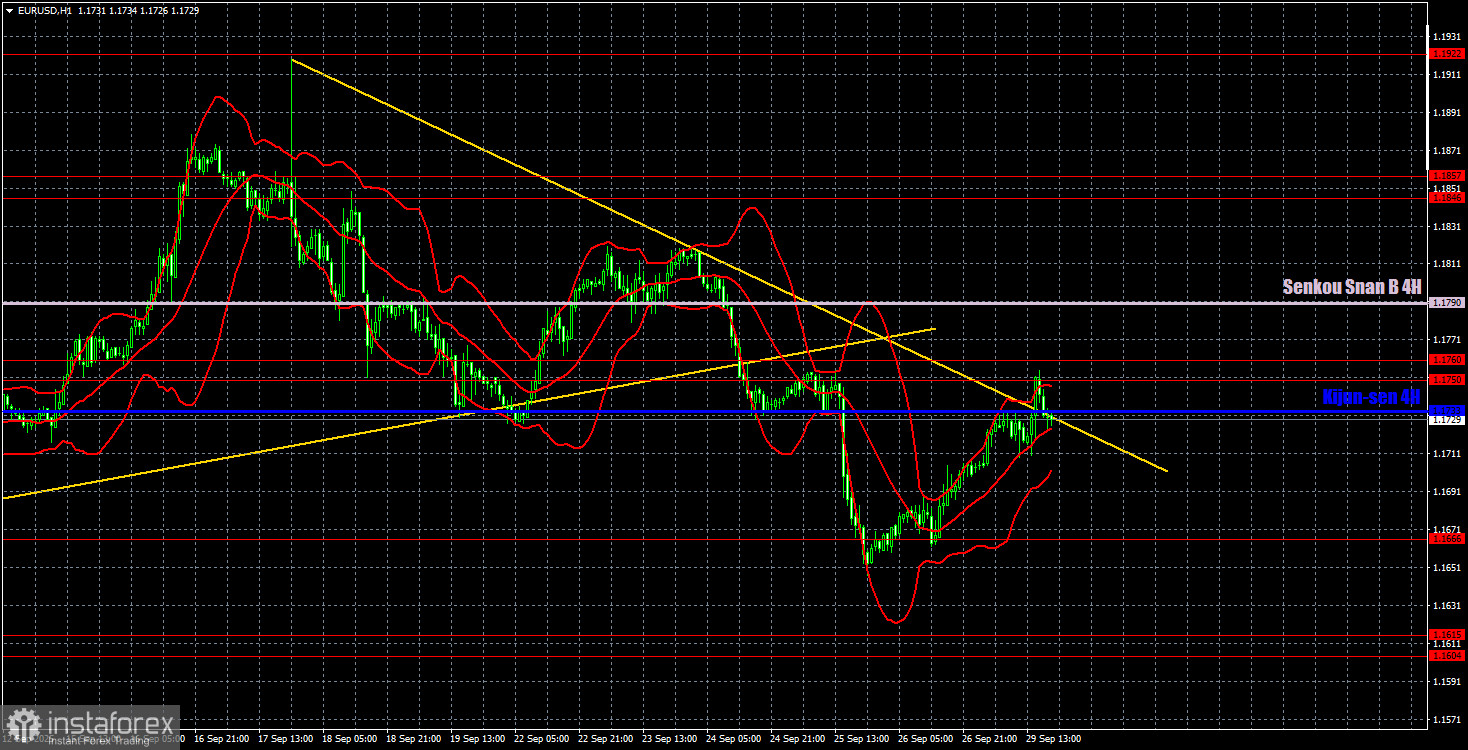
On the hourly TF, EUR/USD continues to form a descending trend, which so far cannot be considered complete. We still see no grounds for a prolonged dollar rally. On the daily TF, it is clear that the uptrend remains intact, while the dollar's strengthening looks rather weak. On lower TFs, the U.S. currency is rising, but this trend may come to an end soon.
For September 30, we highlight the following levels for trading: 1.1234, 1.1274, 1.1362, 1.1426, 1.1534, 1.1604–1.1615, 1.1666, 1.1750–1.1760, 1.1846–1.1857, 1.1922, 1.1971–1.1988, as well as the Senkou Span B (1.1790) and Kijun-sen (1.1733) lines. The Ichimoku indicator lines may shift during the day, which should be considered when identifying trading signals. Do not forget to place a Stop Loss at breakeven if the price moves 15 points in the right direction—this will protect against possible losses if the signal turns out false.
On Tuesday, several notable events are scheduled in both the EU and the U.S. Germany is expected to release reports on retail sales, inflation, and unemployment. In the U.S., the JOLTs report on job openings will be published. In addition, Christine Lagarde will deliver a speech. Today, volatility should clearly be higher.
Trading Recommendations
On Tuesday, the euro's recovery may continue. Traders need to break through the 1.1750–1.1760 area to consider the downtrend complete. A rebound from this area still allows for short positions, but it should be remembered that much this week will depend on the macroeconomic background.
Illustration Explanations:
- Support and resistance price levels – thick red lines where movement may end. They are not trading signal sources.
- Kijun-sen and Senkou Span B lines—These are strong Ichimoku indicator lines transferred to the hourly timeframe from the 4-hour one.
- Extremum levels – thin red lines where the price has previously rebounded. These act as trading signal sources.
- Yellow lines – trend lines, trend channels, and other technical patterns.
- Indicator 1 on the COT charts – the size of the net position for each category of traders.


