


Monday Trade Review:
1H Chart of GBP/USD
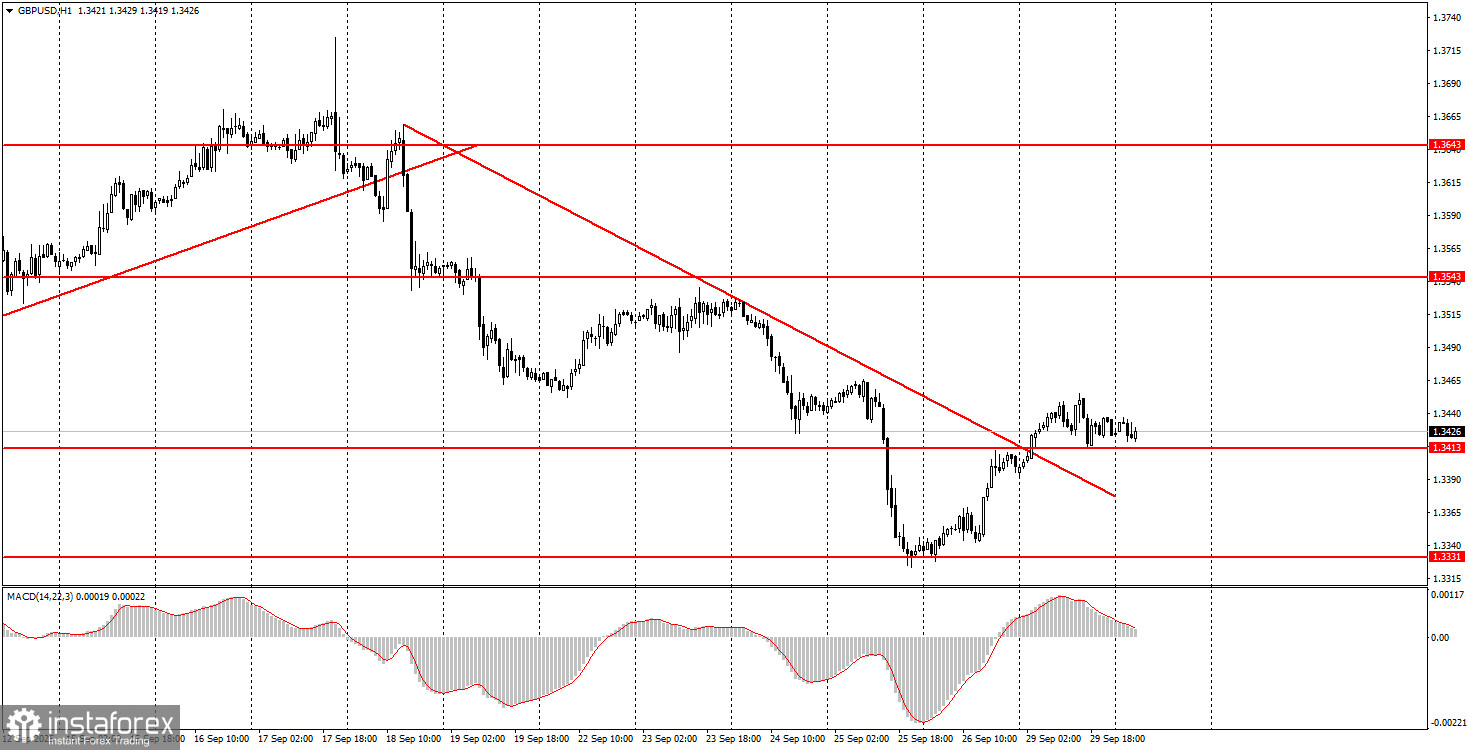
On Monday, GBP/USD also traded with a slight upward bias, but there is one important difference between the technical picture of the pound and that of the euro. The British currency consolidated above a fairly strong descending trendline and also broke through the key level of 1.3413. This strongly suggests that the pound's decline has ended.
Recall that over the past two weeks the market used almost any reason to sell sterling, but overall the fundamental backdrop for the dollar remains much weaker. We tend to view the recent moves as just another correction within the broader uptrend, which will resume sooner or later. On Monday, there were no major events or reports either in the UK or the U.S., but plenty of important releases are expected throughout the week—most of them potentially negative for the dollar.
It is important to understand: U.S. data will push the dollar lower only if the actual figures come in weaker than expected. For instance, Friday's NonFarm Payrolls forecast is just 40,000. It will not be difficult to exceed this number, but even then the figure itself would still be very weak in absolute terms.
5M Chart of GBP/USD
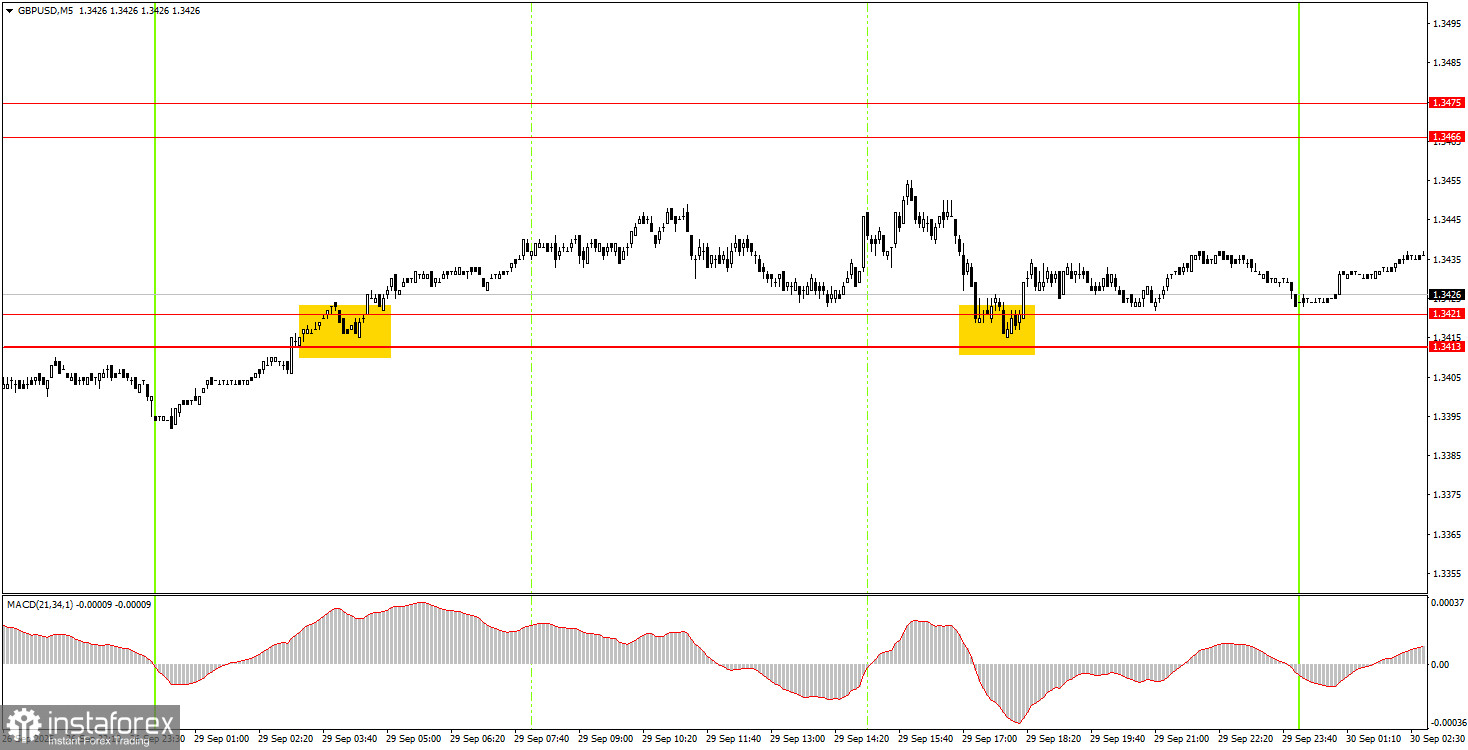
On the 5-minute timeframe, two reasonably good buy signals were formed on Monday. First, the price broke through the 1.3413–1.3421 area, and then bounced off it from above. In both cases, novice traders could have opened long positions, but due to the day's low volatility, profits would have been limited regardless of the signal. The nearest target was not reached, but the price's position above 1.3413–1.3421 keeps the bullish outlook intact.
How to Trade on Tuesday:
In the hourly timeframe, GBP/USD has completed the formation of its downtrend. As we have noted, there are no fundamental reasons to expect prolonged dollar strength, so medium-term prospects still point northward. Recent developments in the UK and the U.S. did provide temporary support for the dollar, and its rise was justified. However, the broader fundamental background still works against it.
On Tuesday, the GBP/USD may continue its upward move, as the downtrend appears to be over. Since the price has broken through the 1.3413–1.3421 area, novice traders may consider opening new long positions or holding existing ones, with the target at 1.3466–1.3475.
On the 5-minute timeframe, the following levels may be used for trading: 1.3102–1.3107, 1.3203–1.3211, 1.3259, 1.3329–1.3331, 1.3413–1.3421, 1.3466–1.3475, 1.3529–1.3543, 1.3574–1.3590, 1.3643–1.3652, 1.3682, 1.3763. On Tuesday, the UK will release the final estimate of Q2 GDP, while the U.S. will publish the JOLTs job openings report. Neither release is considered highly significant, but with no other major events scheduled, they may still influence intraday sentiment.
Core Trading System Rules:
- Signal Strength: The shorter the time it takes for a signal to form (a rebound or breakout), the stronger the signal.
- False Signals: If two or more trades near a level result in false signals, subsequent signals from that level should be ignored.
- Flat Markets: In flat conditions, pairs may generate many false signals or none at all. It's better to stop trading at the first signs of a flat market.
- Trading Hours: Open trades between the start of the European session and the middle of the US session, then manually close all trades.
- MACD Signals: On the hourly timeframe, trade MACD signals only during periods of good volatility and a clear trend confirmed by trendlines or trend channels.
- Close Levels: If two levels are too close (5–20 pips apart), treat them as a support or resistance zone.
- Stop Loss: Set a Stop Loss to breakeven after the price moves 20 pips in the desired direction.
Key Chart Elements:
Support and Resistance Levels: These are target levels for opening or closing positions and can also serve as points for placing Take Profit orders.
Red Lines: Channels or trendlines indicating the current trend and the preferred direction for trading.
MACD Indicator (14,22,3): A histogram and signal line used as a supplementary source of trading signals.
Important Events and Reports: Found in the economic calendar, these can heavily influence price movements. Exercise caution or exit the market during their release to avoid sharp reversals.
Forex trading beginners should remember that not every trade will be profitable. Developing a clear strategy and practicing proper money management are essential for long-term trading success.


