


Trend Analysis (Figure 1)
On Tuesday, the market may continue to move upward from the level of 1.3423 (yesterday's daily candlestick close), targeting 1.3476 – the 38.2% retracement level (blue dashed line). Upon testing this level, the price may begin to move downward, targeting 1.3449 – the 8-period EMA (thin blue line).
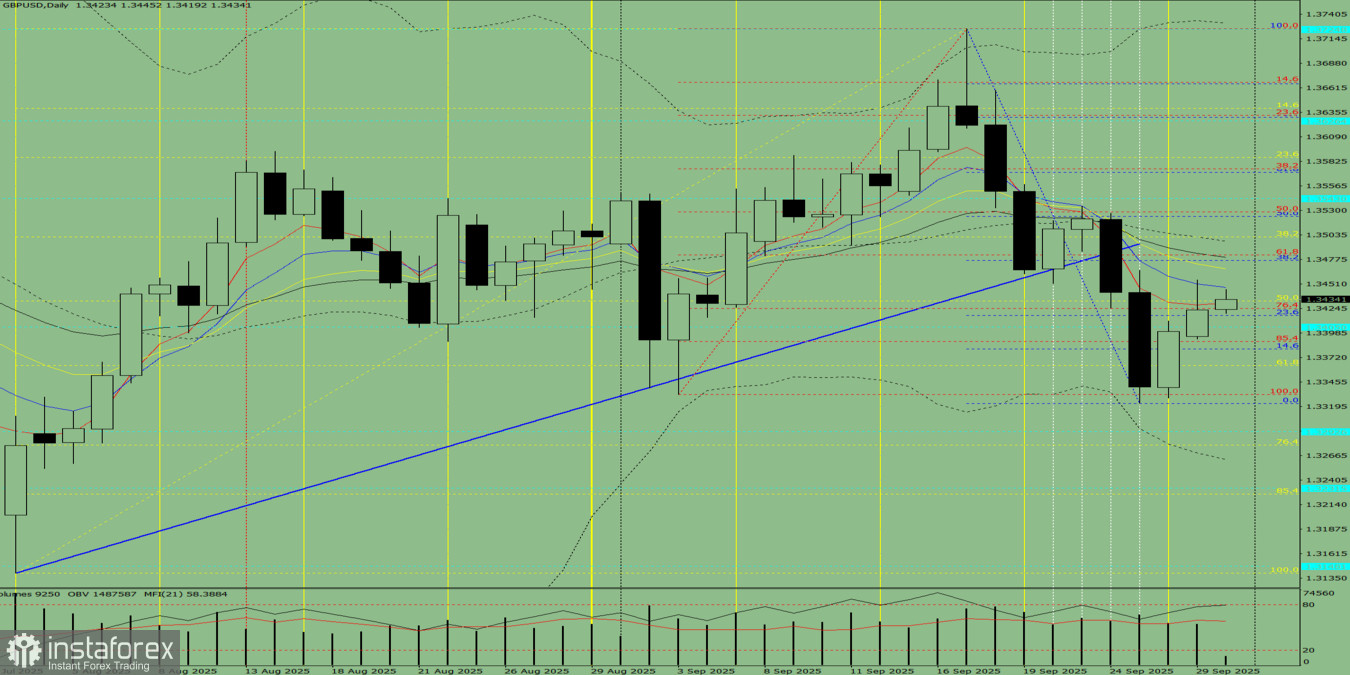
Figure 1 (Daily Chart)
Comprehensive Analysis:
- Indicator analysis – upward;
- Volume – upward;
- Candlestick analysis – upward;
- Trend analysis – upward;
- Bollinger Bands – upward;
- Weekly chart – upward.
Overall Conclusion: Upward trend.
Alternative Scenario: From the level of 1.3423 (yesterday's daily candlestick close), the price may continue to move upward, targeting 1.3448 – the 8-period EMA (thin blue line). Upon testing this level, the price may begin to move downward, targeting 1.3417 – the 23.6% retracement level (blue dashed line).


