


On Tuesday, the GBP/USD currency pair traded with minimal volatility once again. The looming threat of a U.S. government shutdown had virtually no impact on trader sentiment — but that may not be the real reason. More likely, the market simply isn't willing to take risks right now or open positions that it might seriously regret in a few days. This explains both the low trading activity and the muted volatility.
The dollar's position remains as vulnerable as ever. The greenback fell like a stone in early 2025, even as both the European Central Bank and the Bank of England were cutting interest rates. Now, roles have reversed: the ECB and BoE are taking a wait-and-see approach, while the Fed is moving toward easing. We don't need to spell out what that means for the dollar.
Additionally, we have the ongoing trade war. This was one of the key drivers behind the dollar's collapse in 2025. While Trump hasn't introduced any new tariffs lately, no one is under the illusion that the trade tensions are over. The market may have hoped that the worst was behind us, but once again, Trump proved that "rock bottom" is a relative term. A few weeks ago, he raised tariffs on Indian imports to 50% in response to New Delhi's refusal to stop buying Russian oil and gas. And just last week, he imposed tariffs on all imported medicines, furniture, and pickup trucks — with medications now taxed at a hefty 100%.
Why hold back, right?
So, anyone expecting things to calm down on the trade front is in for a rude awakening. And let's not forget about U.S. economic data and the ongoing pressure on the Federal Reserve. Traders might not even see new macro data this week if the shutdown starts on October 1. We don't recall whether the U.S. Bureau of Labor Statistics shut down during the last government shutdown (which also happened under Trump), but the possibility exists.
If the reports do get published this week, expectations are so low that almost anything could be seen as a positive surprise. For example, if the U.S. economy created just 50,000 jobs outside the agricultural sector in September — a very modest number — it might still be considered bullish for the dollar simply because forecasts are even lower. That said, even if the dollar rises on such data, it won't change underlying conditions: the labor market won't actually be stronger, the Fed won't stop cutting rates, inflation won't magically fall, and Trump certainly won't stop pressuring the Fed.
Truthfully, we'd need five or six more articles just to cover all the factors contributing to the dollar's long-term decline. We would even argue that the shutdown is far from the biggest problem facing the U.S. currency.
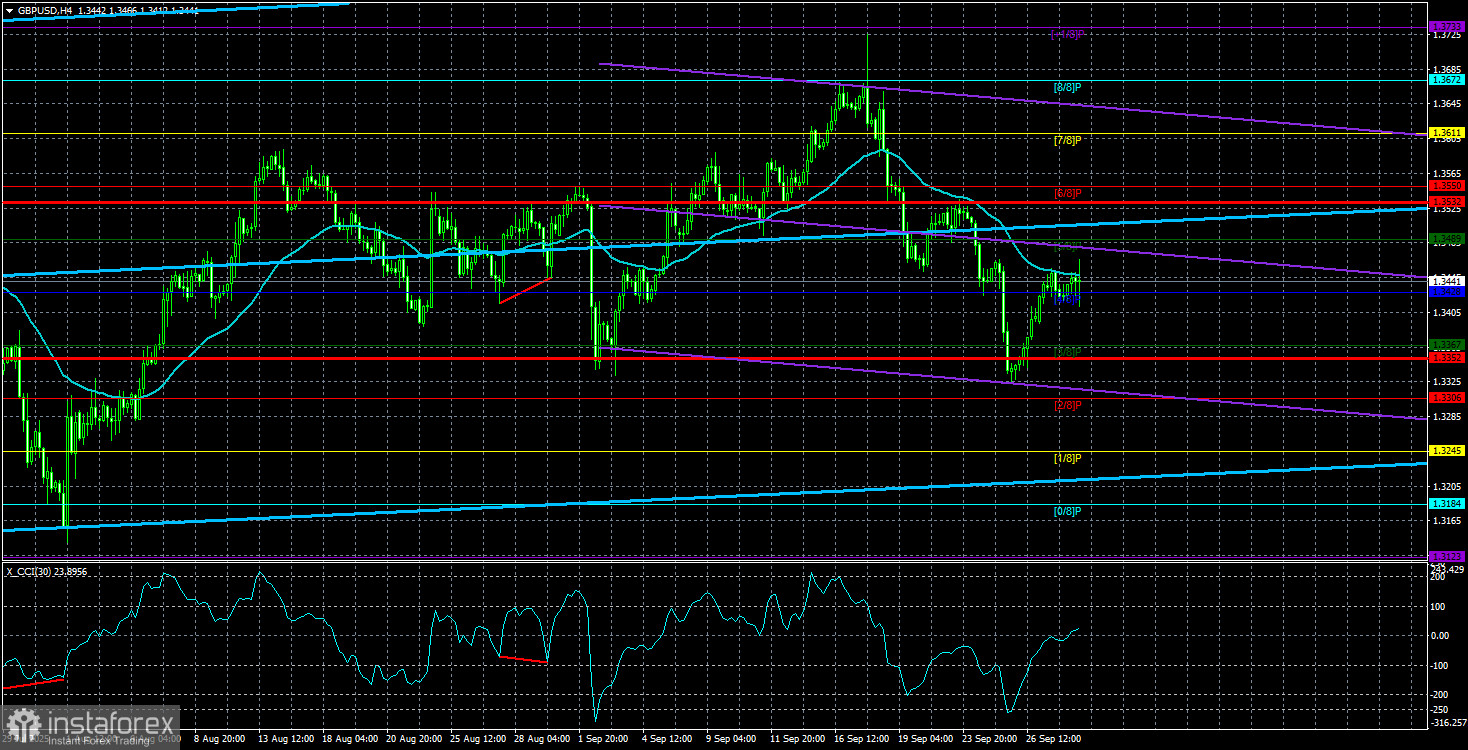
On the daily time frame, the pair has been correcting for a couple of months, but there's still no sign of a reversal in the overall uptrend. In the bigger picture, the pair remains in a broad sideways range (flat).
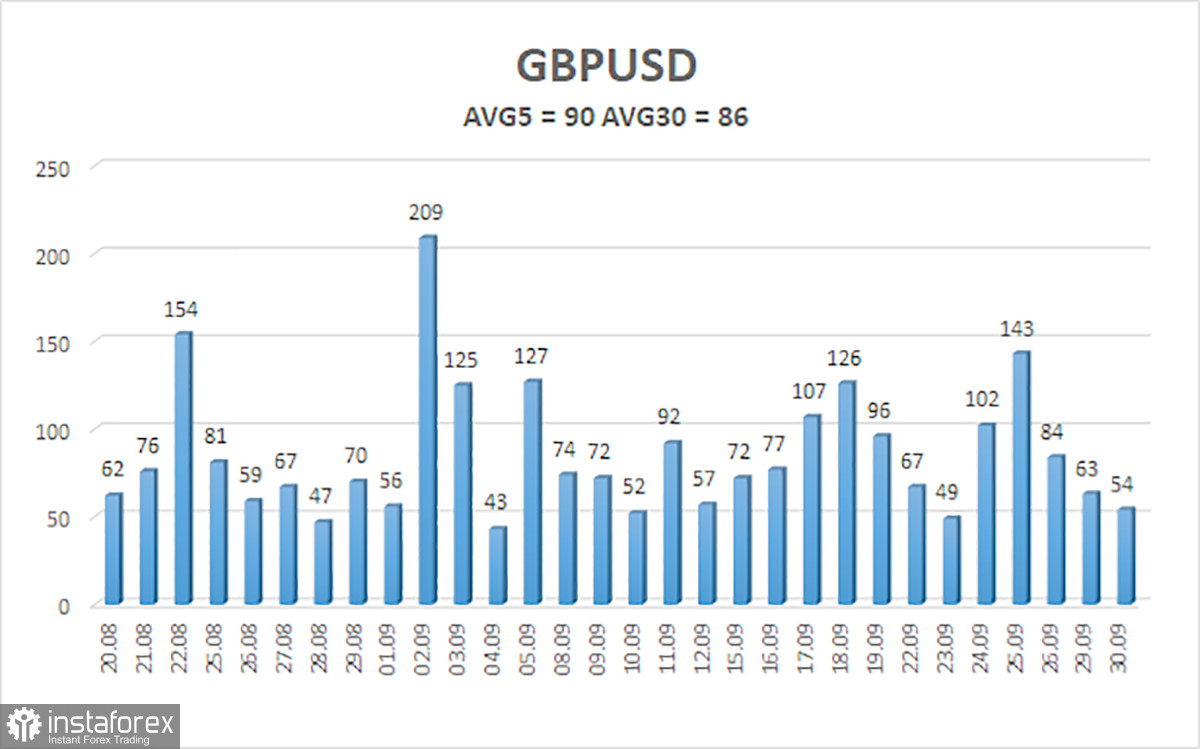
As of October 1, the average volatility for the GBP/USD pair over the last five trading days stands at 90 pips, which is moderate for this pair. On Wednesday, we expect movement within the 1.3352-1.3532 range. The longer-term linear regression channel is still pointing upward, indicating a clear uptrend. The CCI indicator has once again entered oversold territory, signaling a potential resumption of the upward movement.
Nearest Support Levels:
- S1 – 1.3428
- S2 – 1.3367
- S3 – 1.3306
Nearest Resistance Levels:
- R1 – 1.3489
- R2 – 1.3550
- R3 – 1.3611
Trading Recommendations:
GBP/USD is currently undergoing a correction, but its long-term bullish outlook remains intact. Donald Trump's policies will continue to pressure the dollar, so we do not expect a sustained rebound in the U.S. currency.
- Long positions remain more relevant with targets at 1.3672 and 1.3733, as long as the price stays above the moving average.
- Conversely, if the price falls below the moving average line, small short positions may be considered based on technical analysis, with targets at 1.3367 and 1.3352.
The U.S. dollar occasionally shows signs of recovery, like it is now, but for the greenback to strengthen in a sustainable, trend-driven manner, the market needs to see real signs of progress — such as the end of the trade war or other significant positive developments.
Chart Elements Explained:
- Linear regression channels help determine the current trend. If both channels point in the same direction, the trend is strong.
- The moving average line (settings 20,0, smoothed) indicates the short-term trend and trade direction.
- Murray levels serve as target levels for moves and corrections.
- Volatility levels (red lines) are the likely price channel for the next day, based on current volatility readings.
- The CCI indicator: dips below -250 (oversold) or rises above +250 (overbought) mean a trend reversal may be near.


