


Trend Analysis (Fig. 1).
On Wednesday, the market from the level of 1.3441 (yesterday's daily candle close) may possibly continue moving upward with the target at 1.3482 – the 61.8% retracement level (red dashed line). When testing this level, the price may roll back downward with the target at 1.3417 – the 23.6% retracement level (blue dashed line).
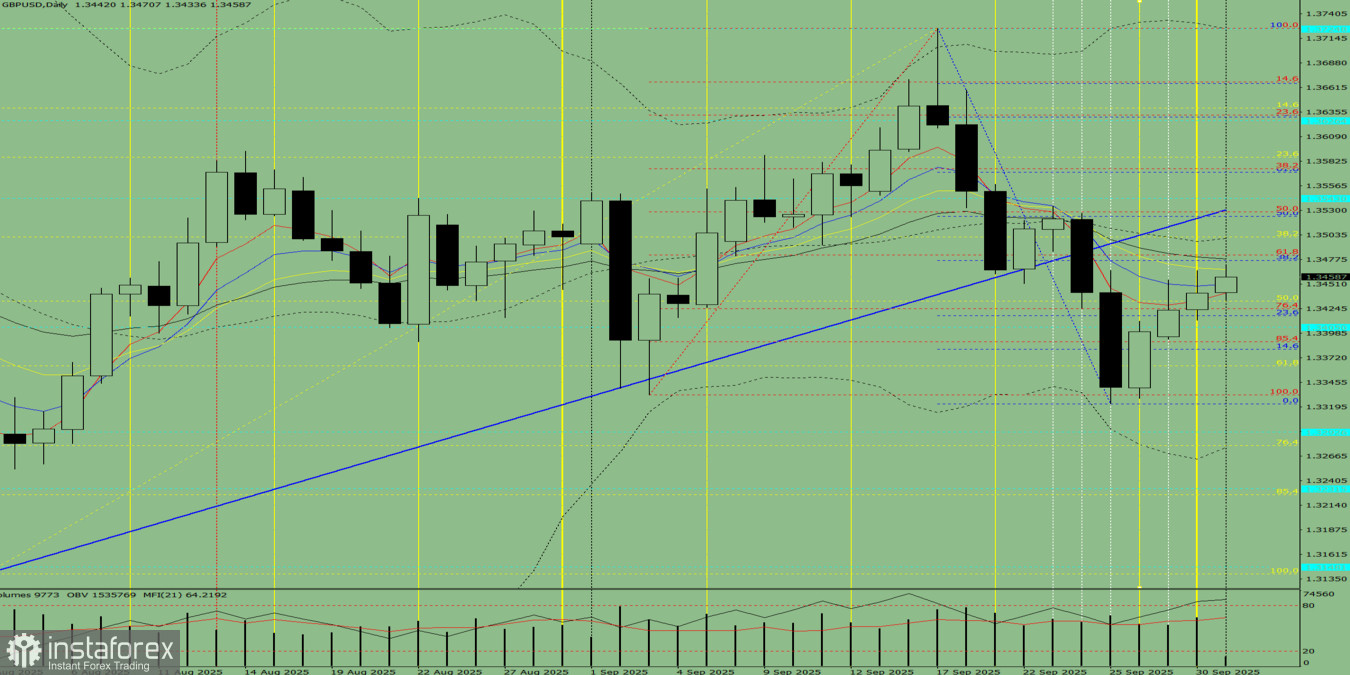
Fig. 1 (daily chart).
Comprehensive Analysis:
- Indicator analysis – upward;
- Fibonacci levels – upward;
- Volumes – downward;
- Candlestick analysis – downward;
- Trend analysis – upward;
- Bollinger Bands – upward;
- Weekly chart – upward.
General conclusion: upward trend.
Alternative scenario: On Wednesday, the market from the level of 1.3441 (yesterday's daily candle close) may possibly continue moving upward with the target at 1.3501 – the 38.2% retracement level (yellow dashed line). When testing this level, the price may roll back downward with the target at 1.3417 – the 23.6% retracement level (blue dashed line).


