


Trend Analysis (Fig. 1).
On Thursday, the market from the level of 1.1729 (yesterday's daily close) may continue moving upward toward the target of 1.1782 – the 50% retracement level (red dashed line). Upon testing this level, the price may roll back downward with a target of 1.1717 – the 38.2% retracement level (blue dashed line).
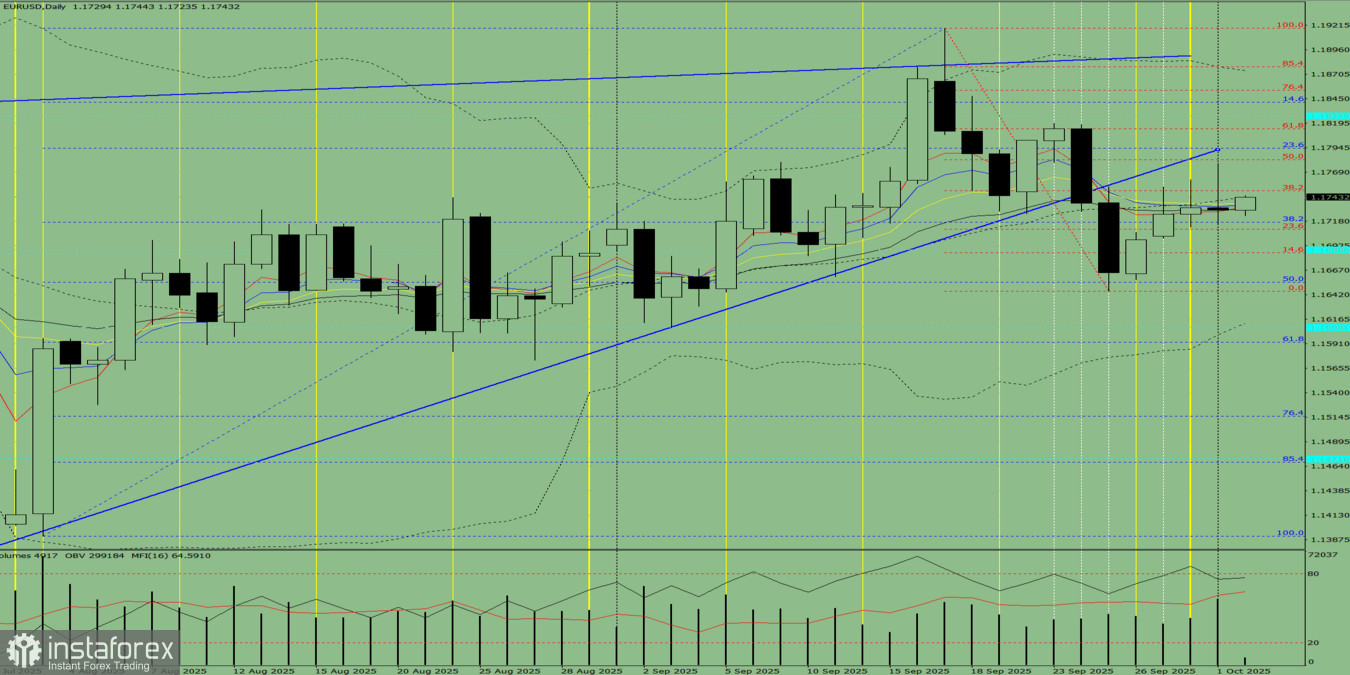
Fig. 1 (daily chart).
Comprehensive Analysis:
- indicator analysis – upward;
- Fibonacci levels – upward;
- volumes – upward;
- candlestick analysis – upward;
- trend analysis – upward;
- Bollinger Bands – upward;
- weekly chart – upward.
General conclusion: upward trend.
Alternative scenario: on Thursday, the market from the level of 1.1729 (yesterday's daily close) may continue moving upward toward the target of 1.1749 – the 38.2% retracement level (red dashed line). Upon testing this level, the price may roll back downward with a target of 1.1685 – the 14.6% retracement level (red dashed line).


