On Thursday, the GBP/USD pair continued to trade very calmly. Still, it is worth recalling that the U.S. dollar has recently accumulated several fresh factors of weakness. Whether the U.S. NonFarm Payrolls and unemployment reports will be released today remains unclear, with contradictory news circulating. However, even without these releases, the situation looks obvious.
We have often noted that ADP and NonFarm Payrolls figures for the same month rarely align closely. The market, therefore, tends to focus more on Nonfarm Payrolls for assessing the labor market. What the two reports do share, however, is the trend: both show different numbers but a consistent deterioration month after month. So, even if we don't know exactly how many jobs were created in September, we can confidently say the overall count keeps declining.
No one expected that a single round of Fed monetary easing would instantly revive the labor market—certainly not within two weeks. Thus, the weak ADP number was hardly surprising. The real question now is: how should the Fed act, and which data can it rely on if the U.S. Bureau of Labor Statistics halts operations due to the shutdown? If the shutdown truly affects statistical agencies, then no NFP, unemployment, or inflation reports will be available in the near term. This also means the Fed won't have them.
Jerome Powell has repeatedly emphasized that Federal Reserve decisions are data-driven. But without data, how can they decide on rates? After the ADP release, markets raised the probability of a rate cut to 85%, yet even here, we would not be 100% confident about two more cuts before year-end. If inflation continues rising, as it has in recent months, the Fed's decisions could turn out to be far less dovish than the market expects.
It's worth recalling that in recent years, markets have often anticipated aggressive dovish action from the Fed, whereas in practice, the measures have been more modest. Still, if markets are now pricing in two cuts by year-end, why isn't the dollar falling sharply? A shutdown, a labor market setback, and heightened dovish expectations are all fresh factors against the dollar that emerged only in the past week. Listing its global problems again seems redundant—the outlook remains unchanged: dollar weakness. Current sluggish moves appear completely unjustified.

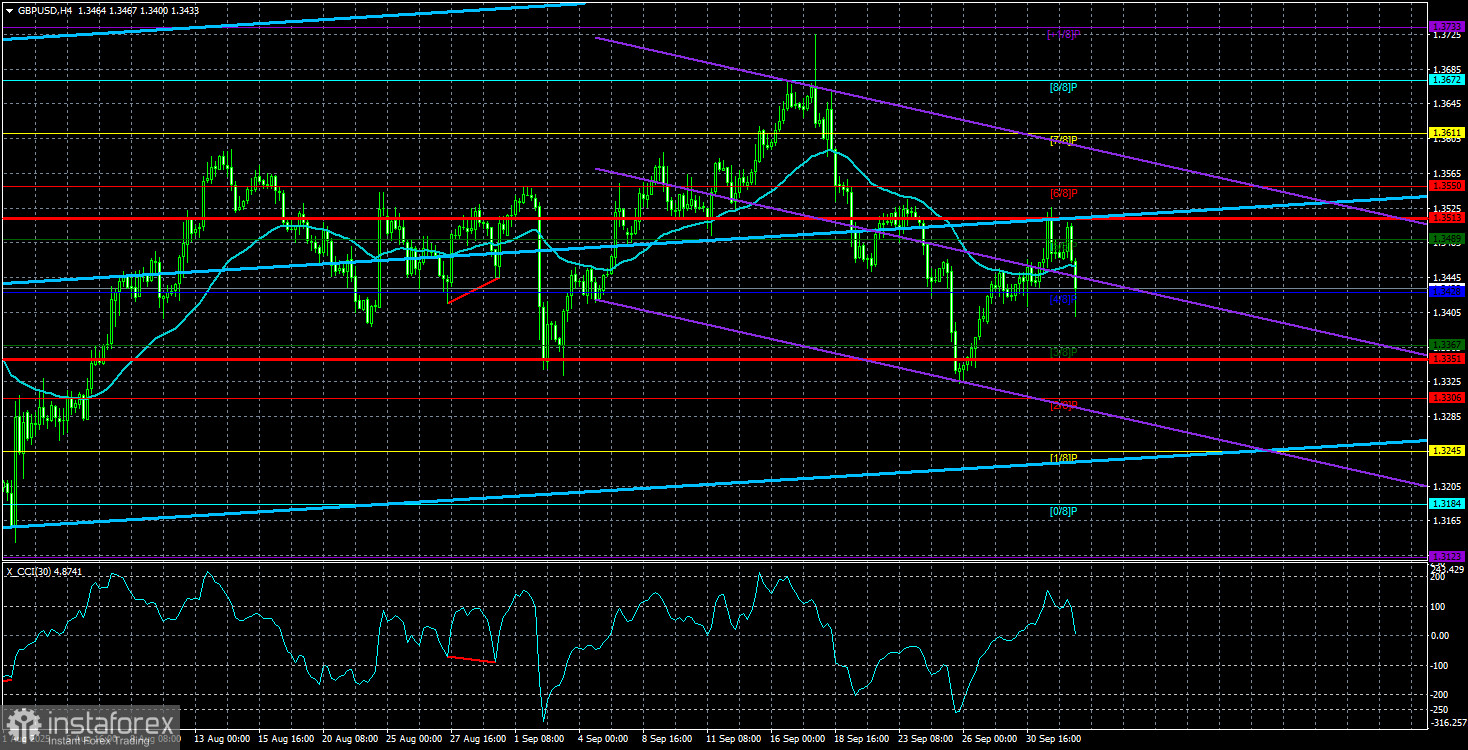
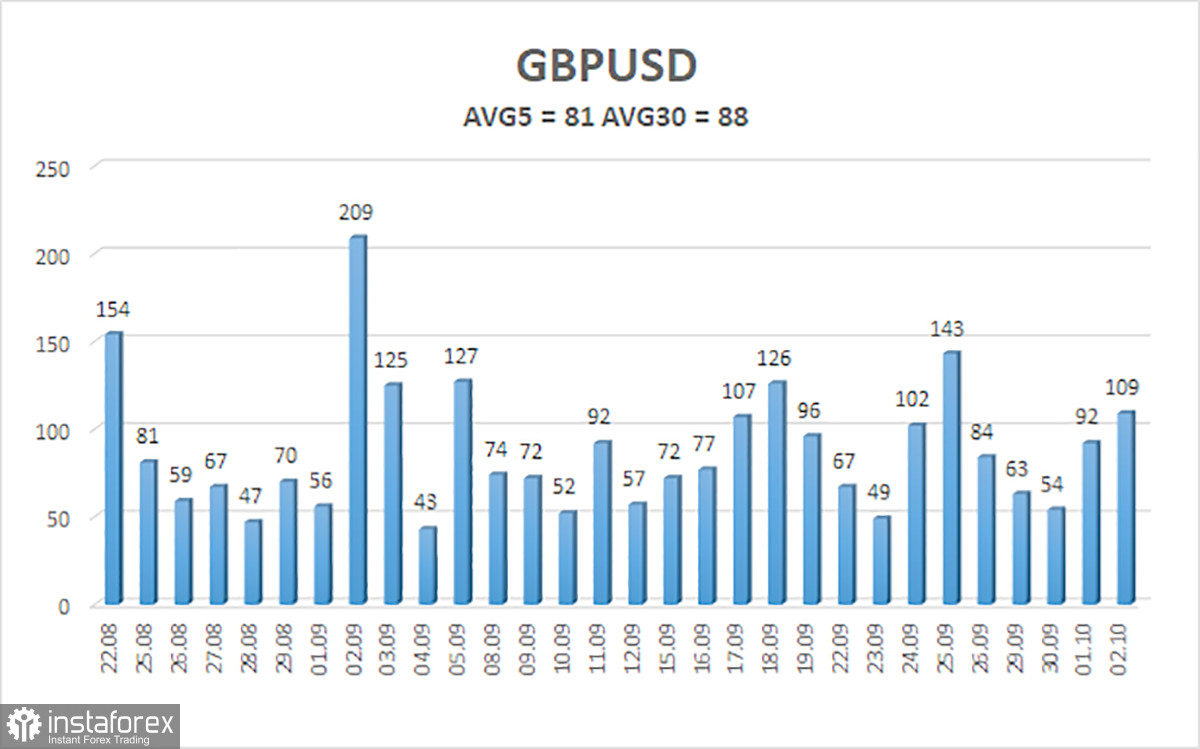
The average GBP/USD volatility over the last five trading days is 81 points, which is classified as "average." On Friday, October 3, we expect movement within the 1.3351–1.3513 range. The higher linear regression channel is pointing upward, signaling a clear bullish trend. The CCI entered oversold territory, again warning of a potential trend resumption.
Nearest support levels:
- S1 – 1.3428
- S2 – 1.3367
- S3 – 1.3306
Nearest resistance levels:
- R1 – 1.3489
- R2 – 1.3550
- R3 – 1.3611
Trading Recommendations:
The GBP/USD pair is in a correction, but its long-term outlook remains unchanged. Donald Trump's policies will continue to pressure the dollar, and we do not expect sustainable growth of the U.S. currency.
As long as the price remains above the moving average, long positions toward 1.3672 and 1.3733 remain the priority. If the price moves below the moving average, small short positions may be considered, with targets at 1.3367 and 1.3351 (based on technical analysis only).
The U.S. dollar exhibits occasional corrections (as seen now), but lasting strength requires clear evidence of the end of the trade war or other major positive developments.
Explanations for Charts:
- Linear regression channels: indicate the current trend. When both channels point in the same direction, the trend is strong.
- Moving average line (20.0, smoothed): shows the short-term trend and trading direction.
- Murray levels: serve as targets for moves and corrections.
- Volatility levels (red lines): likely price channel for the next 24 hours, based on current volatility.
- CCI indicator: entering the oversold zone (below -250) or overbought zone (above +250) signals a potential trend reversal.


