


EUR/USD Analysis – 5M Chart
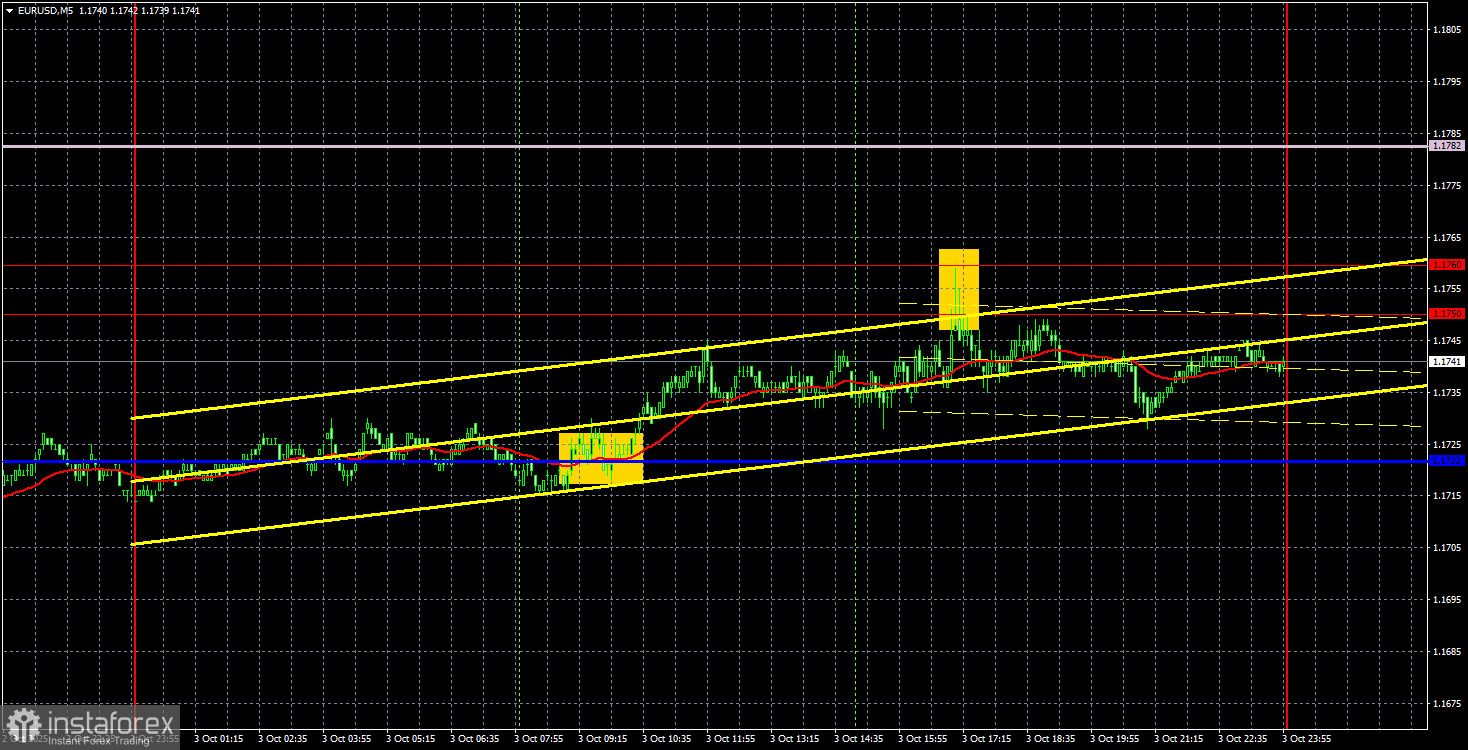
The EUR/USD currency pair showed absolutely no significant movement on Friday. Even on the hourly time frame, it is clearly visible that the pair remained in a total flat throughout the past week. Only once did the price attempt to break out of the range between the Kijun-sen and Senkou Span B lines—on Thursday, when the unemployment rate in the Eurozone unexpectedly rose to 6.3%.
All other, far more important, data was either ignored by the market or responded to very weakly. And that's a shame. There was plenty to pay attention to last week—starting with the U.S. government shutdown. It's hard to believe such a major event, which doesn't happen every year, wouldn't be priced in. ISM business activity indices in the services and manufacturing sectors came in weak, although not disastrous. The ADP employment report posted a very weak result. In short, the dollar had plenty of reasons to fall over the last five trading days.
From a technical perspective, a new upward trend has started since the descending trendline was broken. However, the market remains in a flat range, and until the Senkou Span B line is broken, we will not see the euro strengthening. In our view, the current flat and general pair behavior is completely illogical: the dollar has no reason to grow, while the euro has no fundamental foundation to remain flat or decline.
On Friday, two decent trading signals were formed within the 5-minute timeframe. First, the pair bounced from/broke through the Kijun-sen line, then retested and rebounded from the 1.1750–1.1760 area. Thus, at least one trade could have been opened, which brought some profit.
COT Report
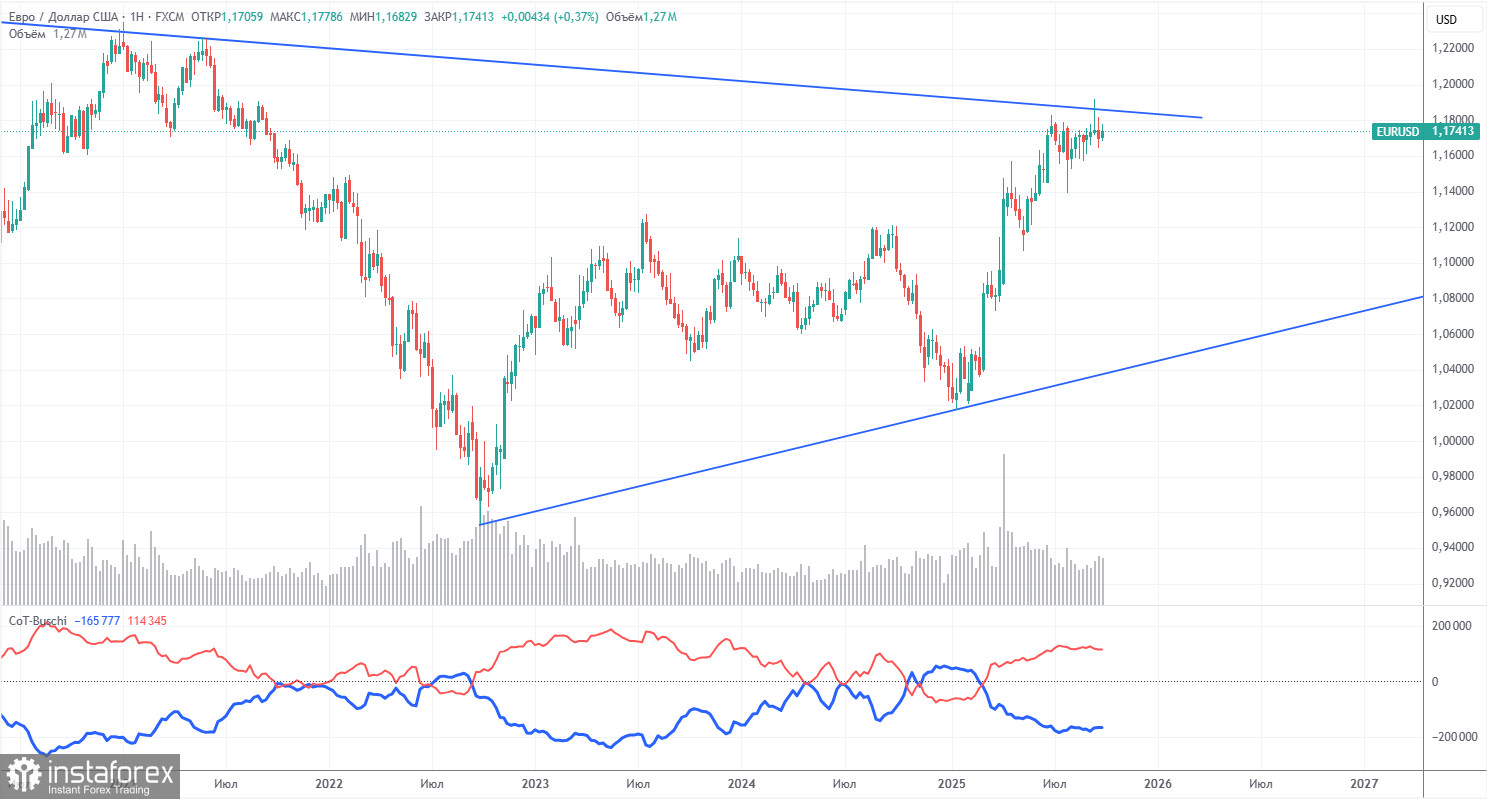
The latest COT report is dated September 23. As shown in the previous illustration, the net position of non-commercial traders has long remained "bullish," while the bears briefly gained dominance at the end of 2024, only to lose it quickly. Since Donald Trump assumed the presidency for the second time, only the dollar has been falling. We can't definitively say this decline in the dollar will continue, but the current global developments suggest that this is the most likely outcome.
We continue to see no fundamental reasons for the euro to strengthen; however, several factors still support further weakening of the dollar. The global downtrend remains intact—but does it really matter where price has moved in the past 17 years? Only after Trump ends his trade wars could the dollar potentially resume growth. However, recent developments suggest trade tensions will persist in one form or another. The potential loss of Federal Reserve independence is another major factor weighing on the U.S. currency.
The positioning of the red and blue lines on the indicator continues to point to a sustained bullish trend. During the latest reporting week, long positions held by the "Non-commercial" category declined by 800, while short positions increased by 2,600. As a result, the net position decreased by 3,400 contracts for the week.
EUR/USD Analysis – 1H Chart
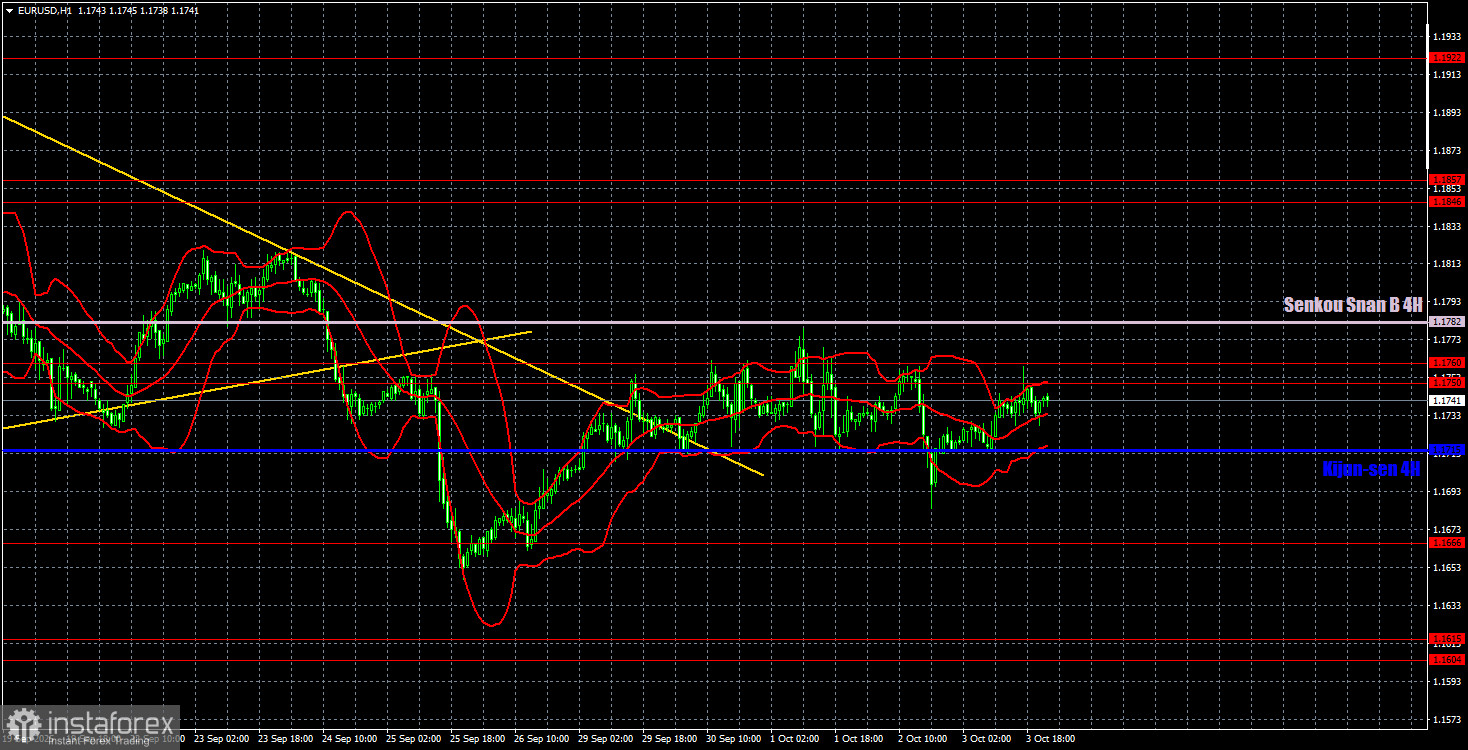
On the hourly chart, EUR/USD continues to form a downward trend, which cannot be considered fully completed since the price remains sideways and has not overcome the 1.1750–1.1760 area and the Senkou Span B line. However, we still see no justification for a rebound in the dollar. The daily timeframe shows the uptrend remains intact.
Key Trading Levels for October 6: 1.1234, 1.1274, 1.1362, 1.1426, 1.1534, 1.1604–1.1615, 1.1666, 1.1750–1.1760, 1.1846–1.1857, 1.1922, 1.1971–1.1988. Senkou Span B line (1.1782), Kijun-sen line (1.1715). Note: The Ichimoku indicator lines fluctuate throughout the day and should be monitored to adjust signals accordingly. Don't forget to place a Stop Loss to breakeven after 15 pips in the right direction—this prevents potential losses if the signal turns out to be false.
European Central Bank President Christine Lagarde will speak on Monday, but no significant changes in policy tone are expected. She may comment on the latest inflation data. Also, eurozone retail sales will be released, but the report is not of high importance. There will be no significant data from the U.S. on Monday.
Trading Recommendations:
On Monday, a recovery attempt by the euro could resume. Traders need to overcome the 1.1750–1.1760 region and the Senkou Span B line to confirm that the downtrend has ended and a new uptrend has begun. A bounce from this area previously served as a good opportunity for short positions targeting 1.1666, but we don't believe in continued dollar strength.
Chart Clarifications:
- Support/Resistance levels – thick red lines, price may reverse around these. They are not trading signals.
- Kijun-sen & Senkou Span B – Ichimoku lines, transferred to the 1H chart from the 4H timeframe. Strong reference lines.
- High/Low levels – thin red lines marking previous reversal zones. They are used as trade signals.
- Yellow lines – trendlines, channels, and various technical patterns.
- Indicator 1 on COT charts – net position size of each trader category.


