


Trend Analysis
This week, from the level of 1.3478 (closing of the last weekly candle), the price may start moving downward with the target of 1.3270 – the historical support level (blue dotted line). When testing this level, the price may rebound upward with the target of 1.3332 – the lower fractal (weekly candle of September 21, 2025).
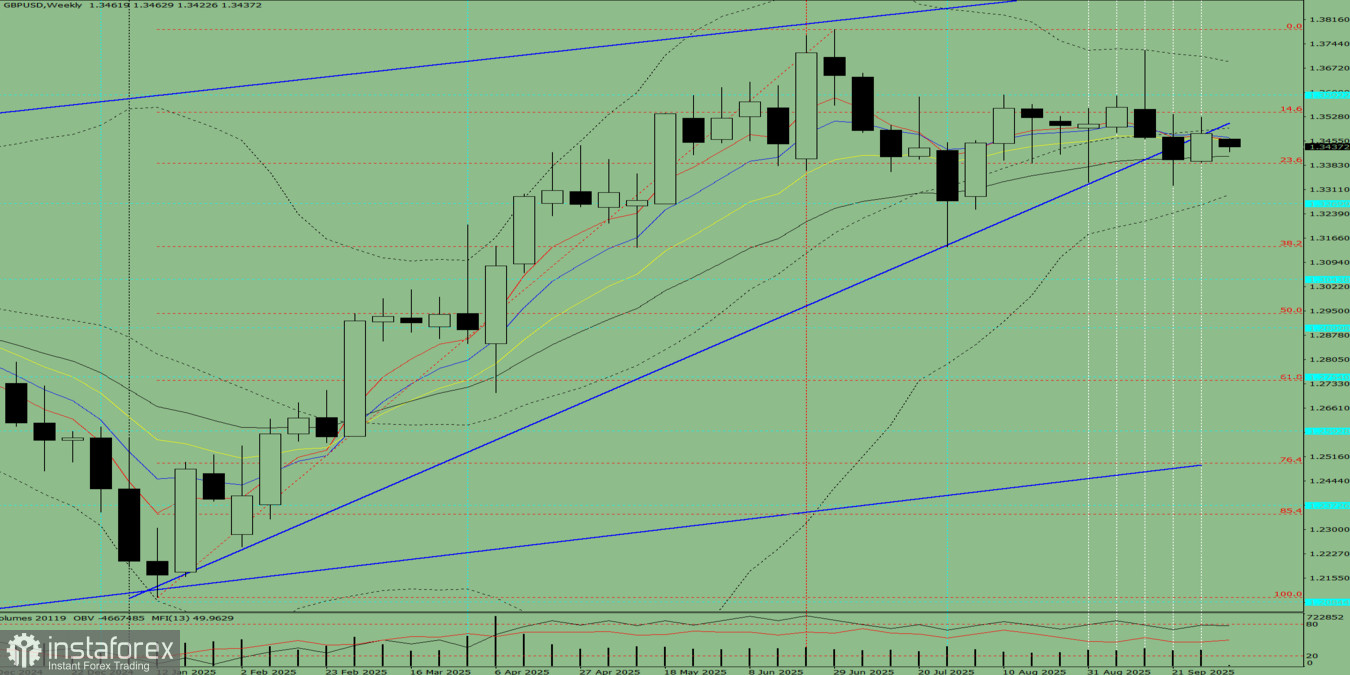
Fig. 1 (weekly chart).
Comprehensive Analysis
- Indicator analysis – down;
- Fibonacci levels – down;
- Volume – down;
- Candlestick analysis – down;
- Trend analysis – down;
- Bollinger Bands – down;
- Monthly chart – down.
Overall conclusion for the GBP/USD weekly chart: The price this week will most likely have a downward tendency, with the absence of an initial upper shadow on the weekly black candle (Monday – down) and the presence of a second lower shadow (Friday – up).
Alternative Scenario: From the level of 1.3478 (closing of the last weekly candle), the price may continue moving downward with the target of 1.3141 – retracement level 38.2% (red dotted line). Upon reaching this level, the price may move upward with the target of 1.3270, the historical support level (blue dotted line).


